Email Reporting Home
Email Reporting for A/B Testing Campaigns
Accessing
From the Email menu, choose Email Reporting.
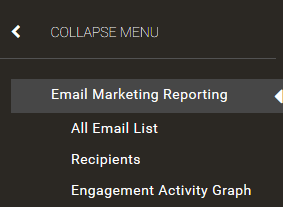
Fly Out Navigation
The flyout navigation is accessed through an icon of three parallel bars -
 located in the upper left on the email reporting landing page.
Flyout Navigation:
Filters and Opens by Device
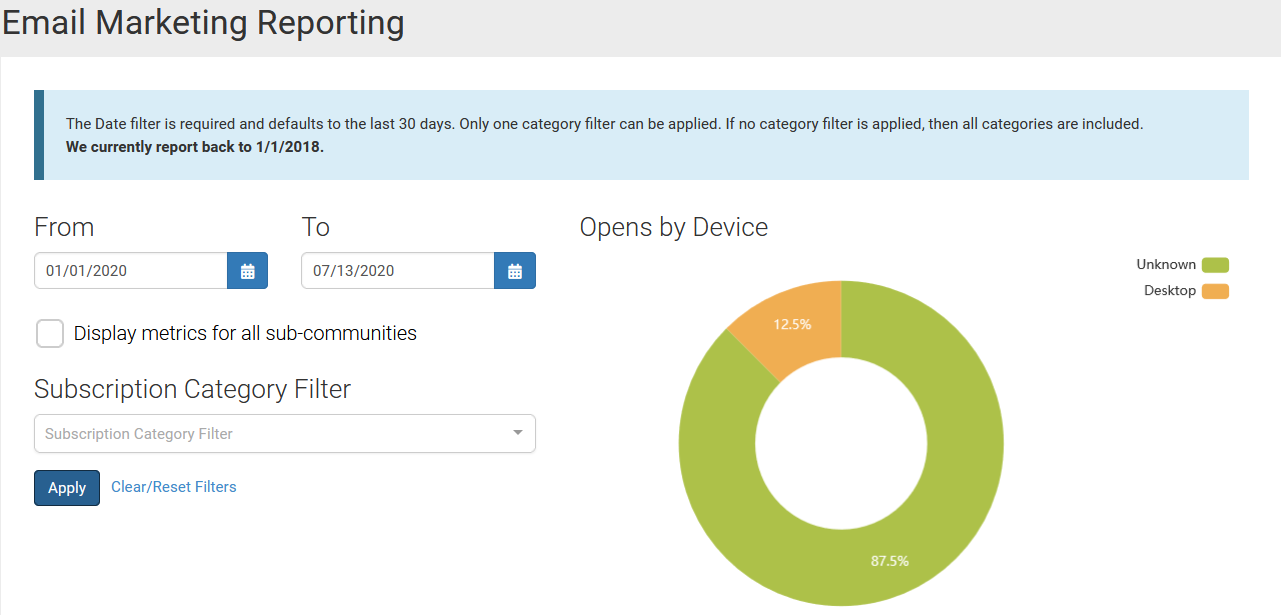
The default date range is the last thirty days but this filter can be modified to a range of your choosing.
The earliest date you can set is 1/1/2018.
The "Display metrics for all sub-communities" checkbox will only display at the GID 1 or the top-level community/site.
The subscription category filter auto-completes and you can only select one category filter at a time.
Note
This filter will not display if the "Display metrics for all sub-communities" box is checked.
Click the Apply button in order to utilize the filter selections.
Opens by Device will show the top 4 device types and then aggregate the remainder into the "other" percent which also includes unidentifiable devices.
Device types include Mobile Phone, Mobile Device, Tablet, Desktop, and Other.
The Google mail app does not pass a user agent string so it can't be classified.
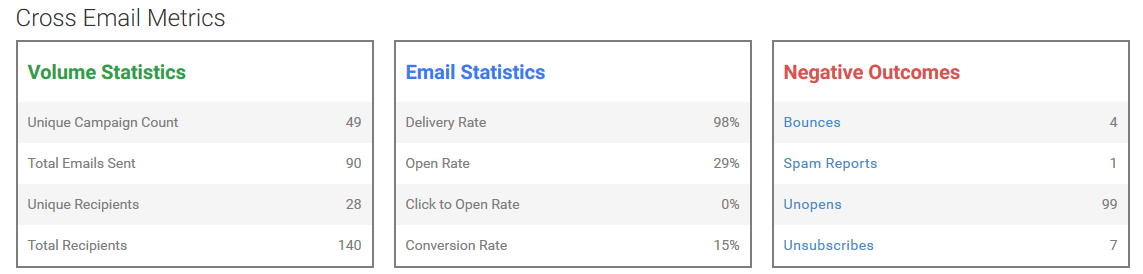
Cross Email Metrics
Definitions for Cross Email Metrics are provided. There is an area for Volume Statistics, Email Statistics, and Negative Outcomes.
The Negative Outcome options are linked so you can drill into those areas.
Hovering over an item will provide a tool tip describing the item.
The filters discussed above will impact the metrics.
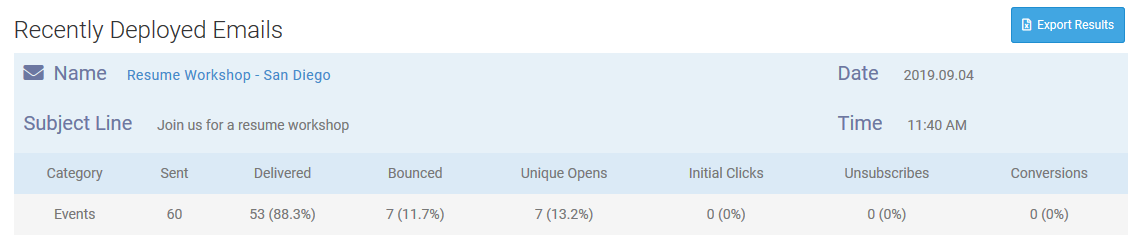
Recently Deployed Emails
The messages shown will change based on the category and date filters applied (discussed above).
Results will be paginated with 10 emails per page.
The name of the email will move admins into detailed Email Reporting data for the message.
The Export Results button will create a csv file with metrics from the last 1000 messages that fit the dashboard filter.
Percents are included in unique export columns.
The columns included in this export are:
emailName
subjectLine
category
sentCount
scheduledDateTimestamp
delivered
deliveredPercent
bounced
bouncedPercent
opens
opensPercent
uniqueOpens
uniqueOpensPercent
clicks
clicksPercent
uniqueClicks
uniqueClicksPercent
initialClicks
initialClicksPercent
conversions
conversionsPercent
unsubscribes
unsubscribePercent
spamReport
spamReportPercent
sentFromGid
NOTE: opensPercent may be over 100% due to duplicate opens. You may want to look at uniqueOpensPercent to get an understanding of the real open rate.
Exports
Exports in Email Reporting give administrators the ability to store and distribute performance metrics.
PNG
Clicking the camera icon on the grey footer downloads a PNG file to your computer that is a scaled snapshot of the reporting content page you are viewing. The PNG is great for printing, sharing as is, or cropping for inclusion in reports.
CSV
Clicking the blue "Export Results" button on any drill down report will download a CSV file to your computer. Columns and values represent all data in the results grid. The export includes limiting values to any search terms applied. Recipient details (name, constituent ID, Encompass Member ID, class year) will be present in the CSV if the data is available in the results grid.
For more information, refer to the Email Reporting Exports Frequently Asked Questions.
Email Reporting FAQs
Please visit the Email Reporting FAQ page for more information.