Best Practices: Event Check-in App Marketing
The Event Check-in App allows you a quick and easy way to ensure accurate participation records for your campus's events. Since its release, many campuses have quickly become champions of the application, promoting attendance tracking as an integrated part of campus culture. If you are implementing use of the Event Check-in App on your campus, check out these ideas and campus examples regarding marketing use of the app:
Keep your branding consistent by customizing your Event Pass
Before you get ready to launch use of ECIA on campus, be sure to customize your Event Pass! You can change the logo and accent color on your campus's mobile pass to make it more easily recognizable for your users.
Utilize Check-in signage to create familiarity
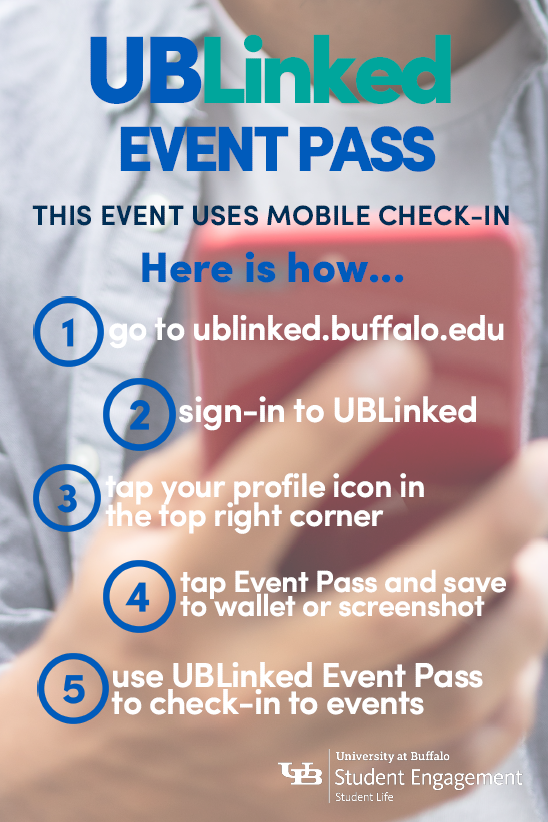
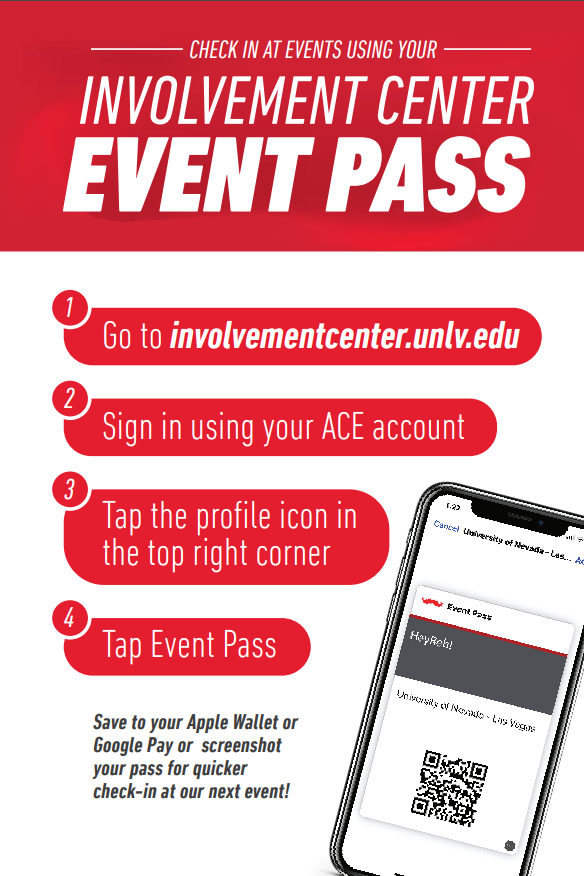
A number of campuses have chosen to create consistent signage that is displayed at campus events utilizing the Check-in app for attendance tracking. Using a repeated marketing tactic allows for students to begin recognizing these signs across campus and knowing immediately what is going to be expected of them. Campuses employing this strategy say this tactic helps integrate the application into campus culture and makes its usage on campus identifiable. Examples of some of our favorite signage are displayed below!
University of Buffalo

University of Nevada, Las Vegas
 |
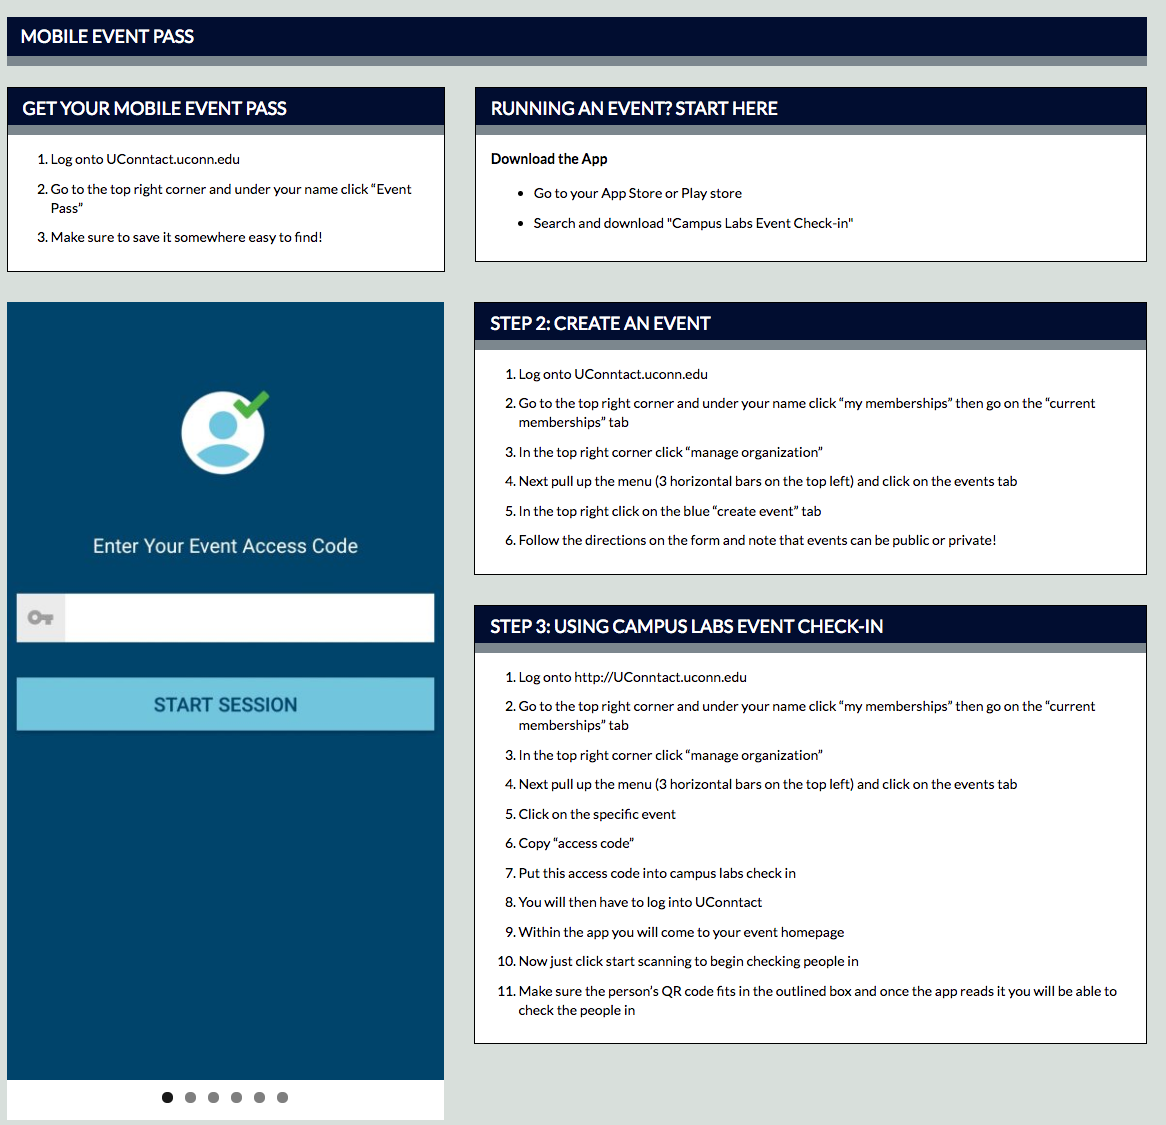
Create a space on your website for ECIA information We love what our campuses have done on their websites to specifically include information about the Event Check-in App! The University of Nevada Las Vegas Event Pass website includes videos and varying sizes of Event Pass instructional handouts and posters. Also check out the webpage for Student Organization Support at UConn for Event Check in App resources, including resources for students and student leaders and videos they have created to walk through the process.
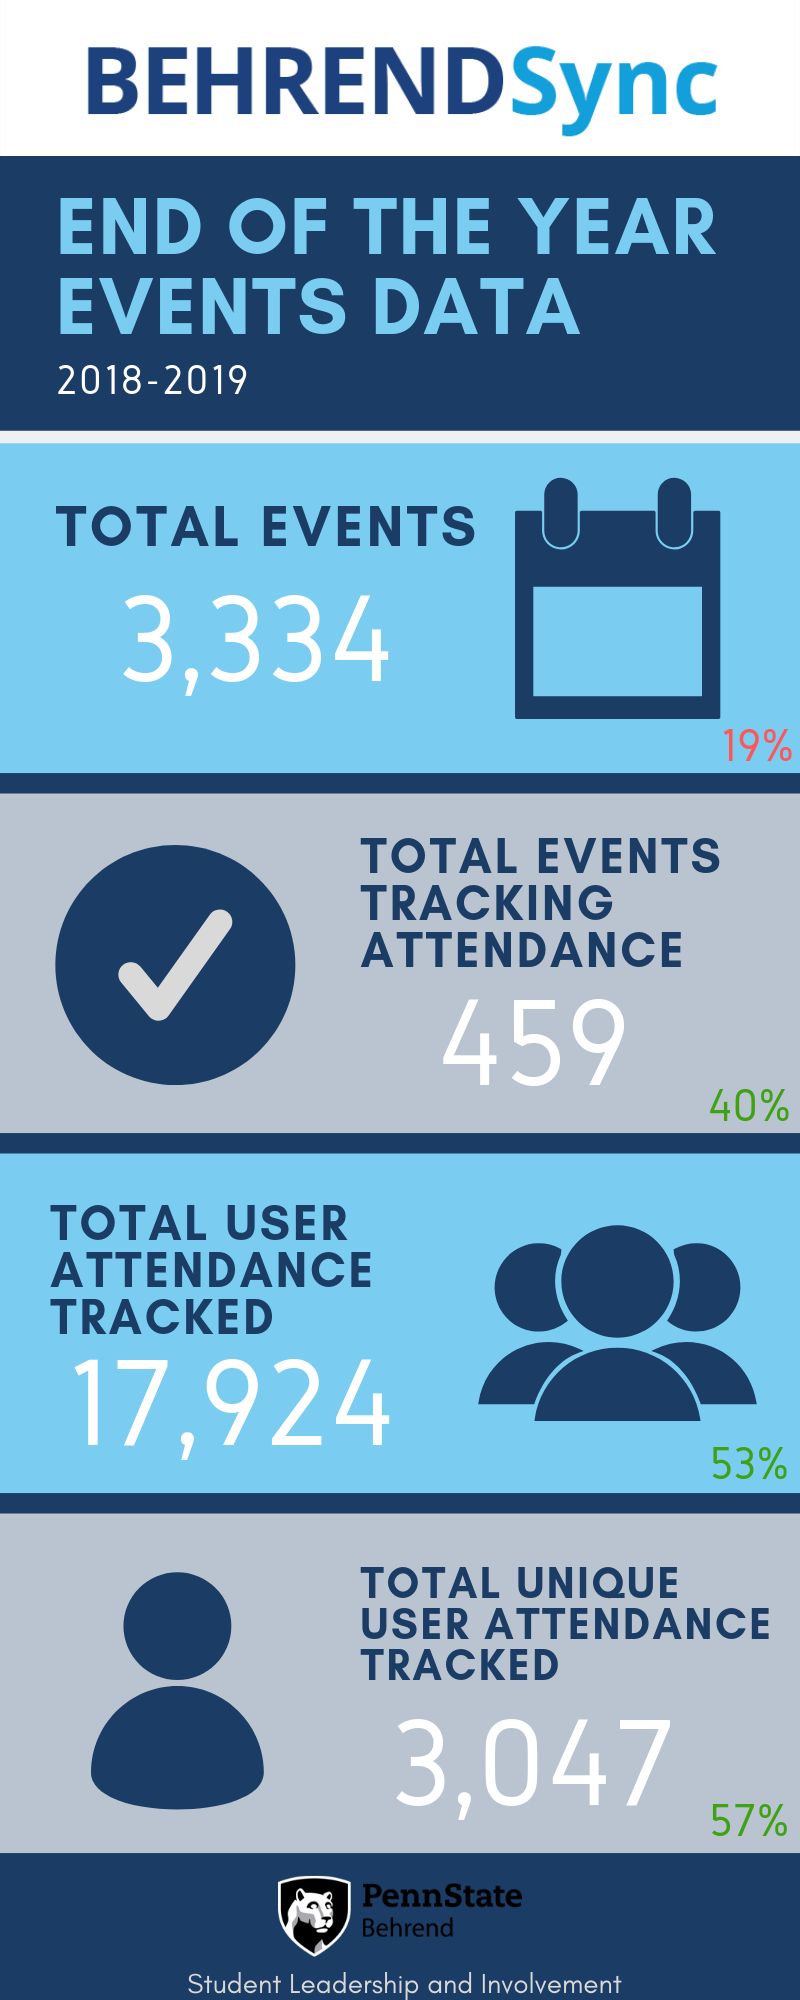
 Spread the (Data) Wealth The Event Check-in App allows you to start collecting event attendance data at a scale you may never have been able to reach before - to help others visualize how meaningful this is, Penn State Behrend created infographics showing important event attendance data points and noting the percentage increase from previous years. In the below infographic, we can see that event attendance went up by over 50% since Behrend began using the Event Check-in App! Sharing this data helps to get everyone excited about the potential of their new tool.