Outcomes Reports
The home screen of Outcomes provides an immediate view the information most campuses are looking to report on:
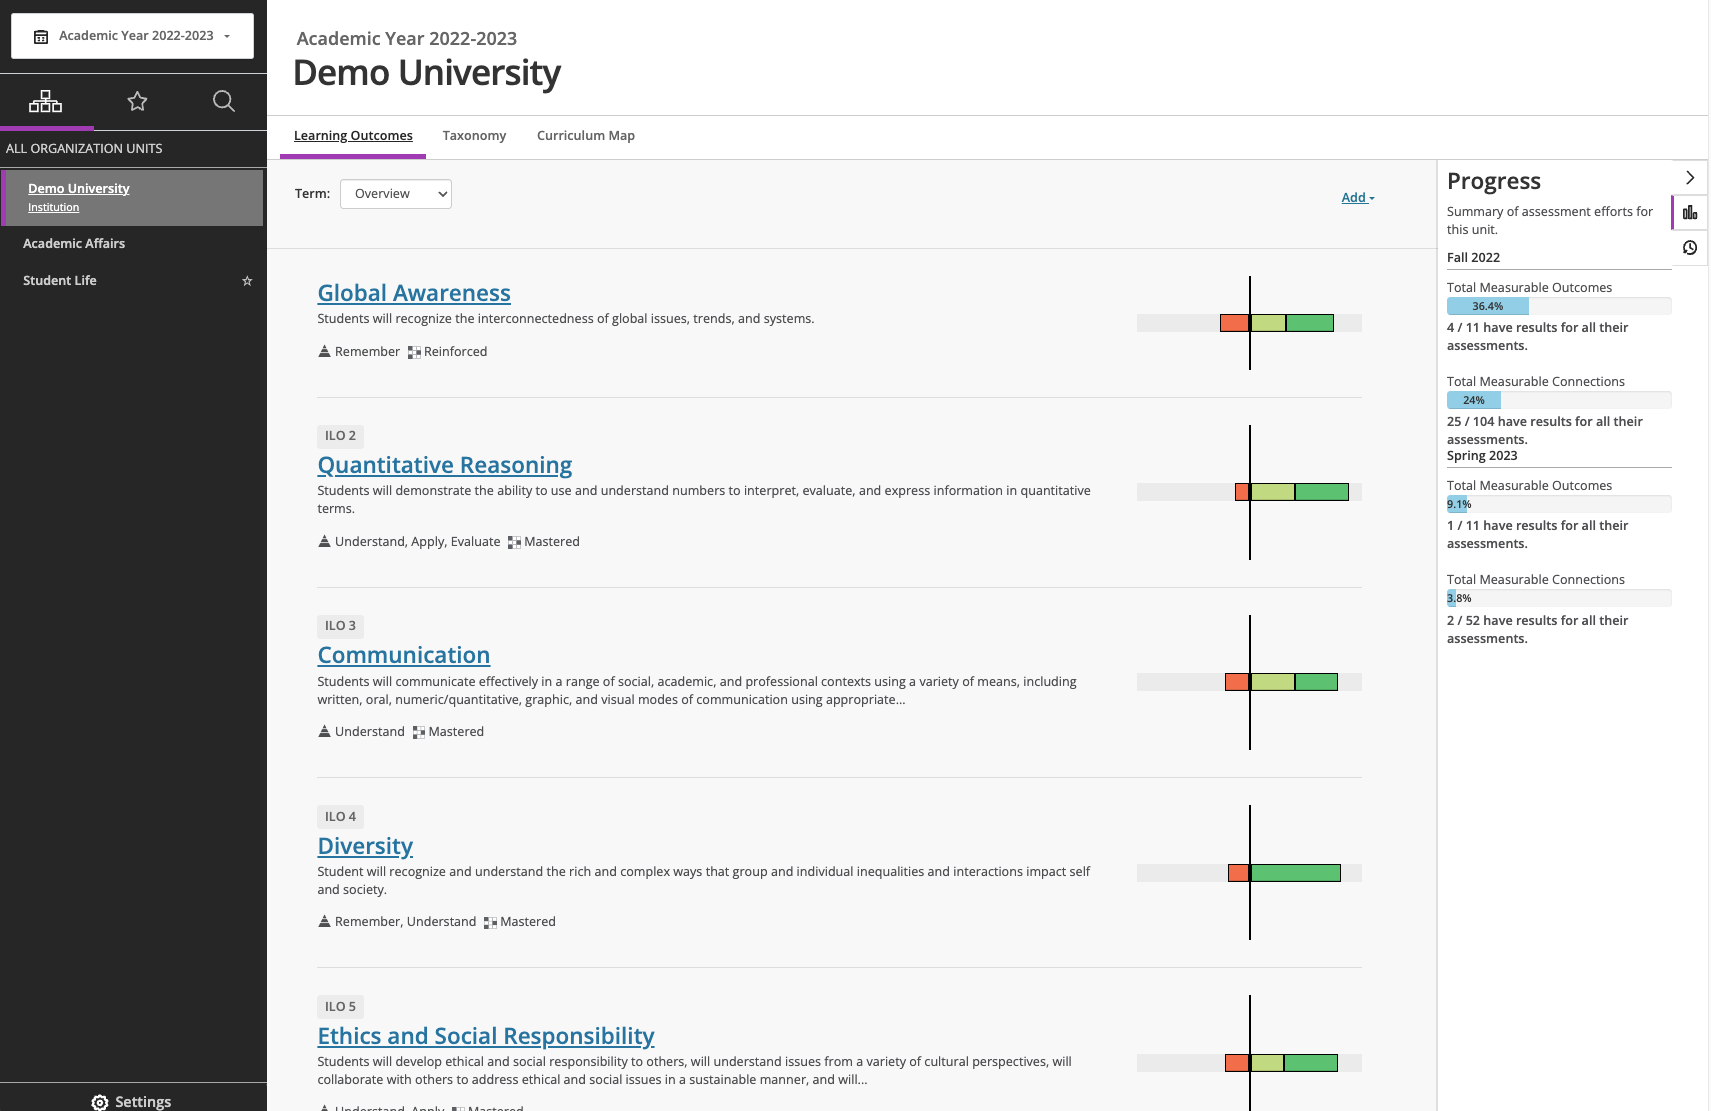
Learning data
Visualization of which outcomes have data associated and which do not.
Visualization of how many students have met or not met each outcome.
Progress
The total number of outcomes scheduled for data collection
The percentage (and raw number) of how many scheduled outcomes contain data
You can look at this information based on your chosen timeframe by selecting your annual year and between terms.
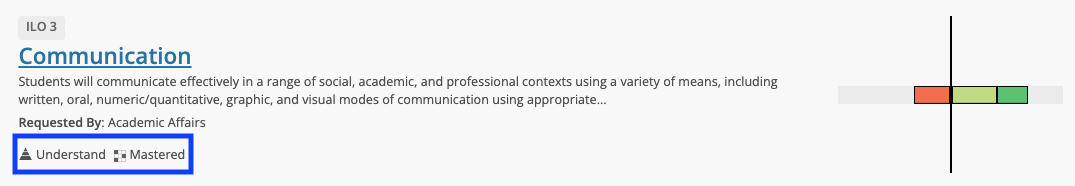
Two types of labels are also provided for each outcome statement:
Level on Bloom’s taxonomy
Level of learning (introduced, reinforced, mastered)
The Activity tab, shows who has been working with the outcomes and when they did it:
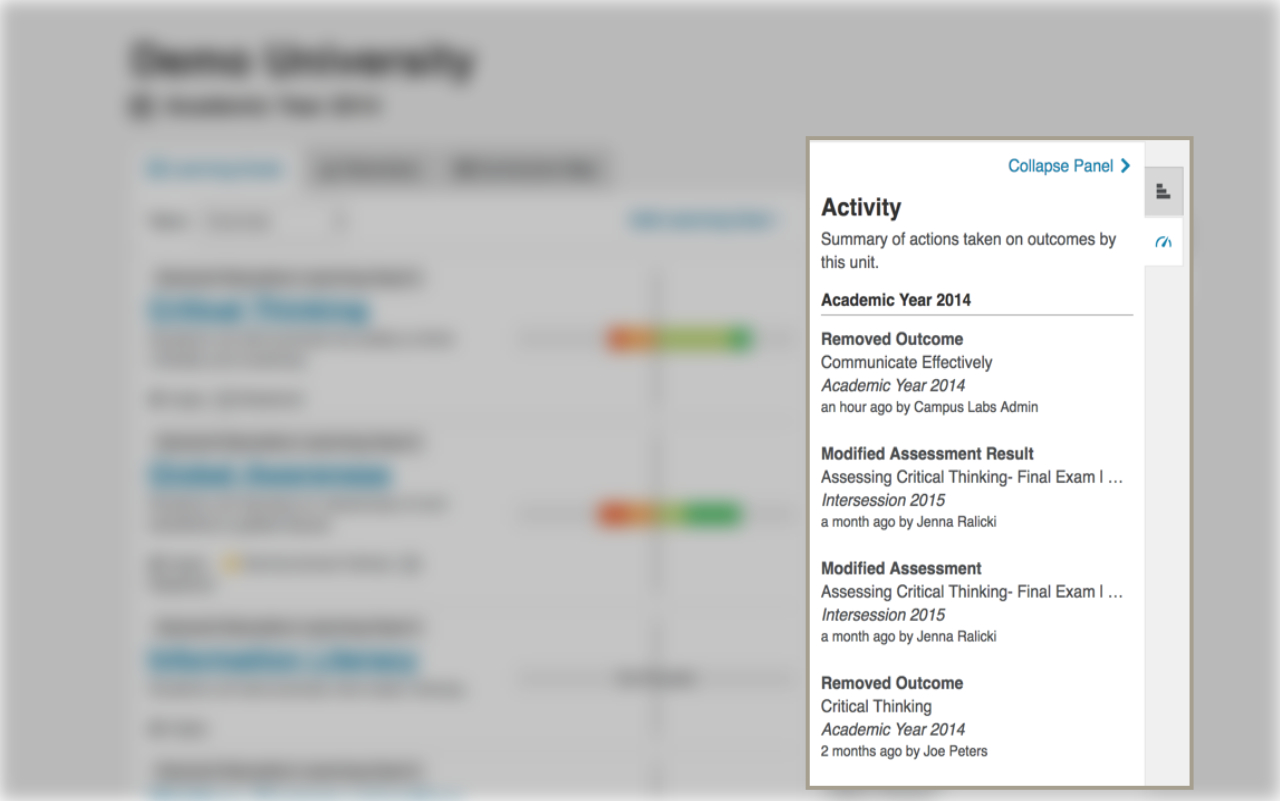 |
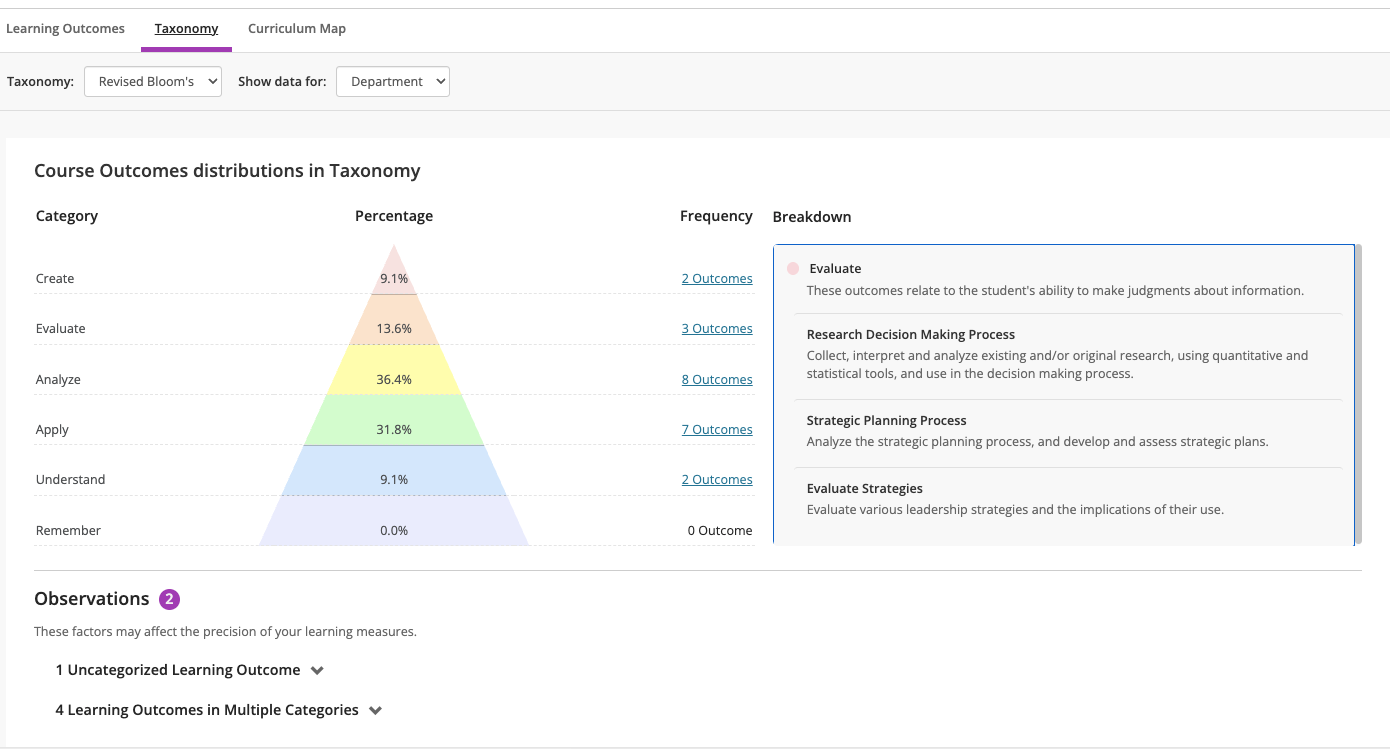
Select the Taxonomy tab to see:
How all the outcomes statements in a given unit are dispersed across Bloom’s Taxonomy
Which statements are not measurable, uncategorized, or in multiple categories and for what reason(s)
A simple toggle will give you an aggregate view of all outcome statements contained under a particular unit.
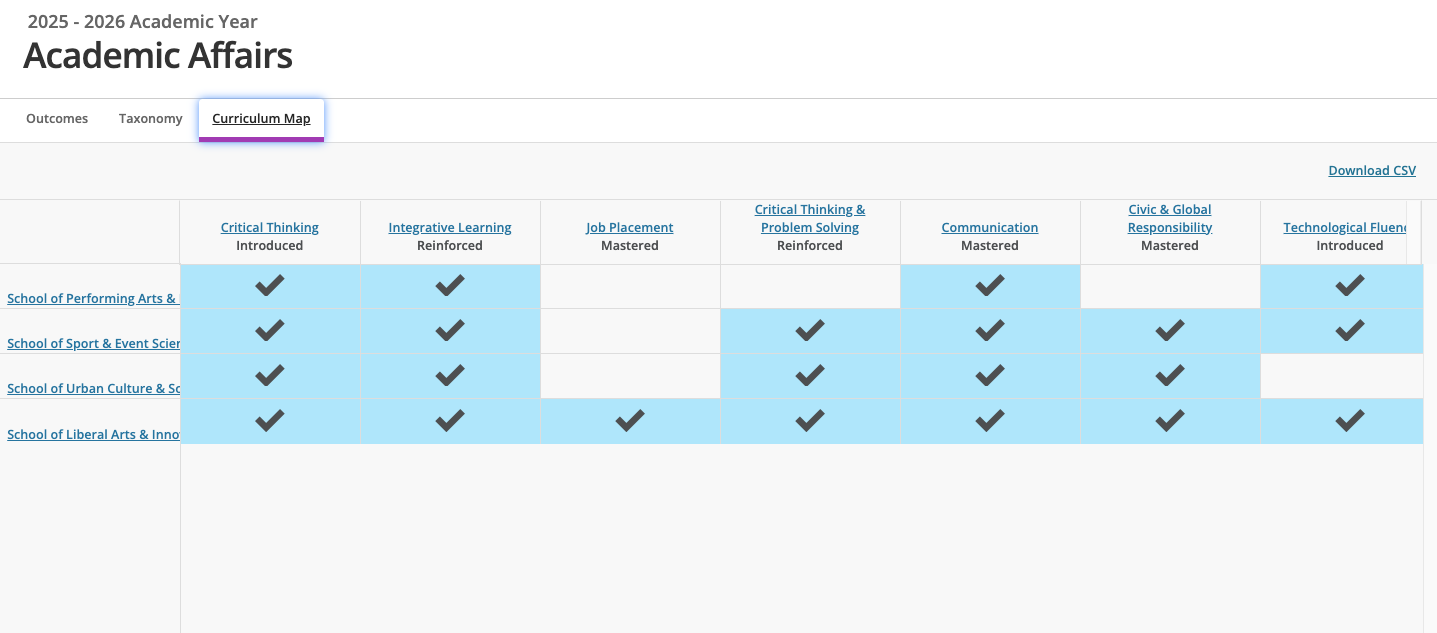
Select the Curriculum Map tab to see:
An auto generated curriculum map for the selected unit that is created through connection of outcomes by either assignment or related.
Click on the check mark to see additional details for the outcome and its assessments.