Enhancements to the Question Mean Analysis Report
Release Date: 03/13/2024
Release Overview
Gain a deeper understanding of mean trends over time with an expansion of the Question Mean Analysis report.
Enhancements
 |
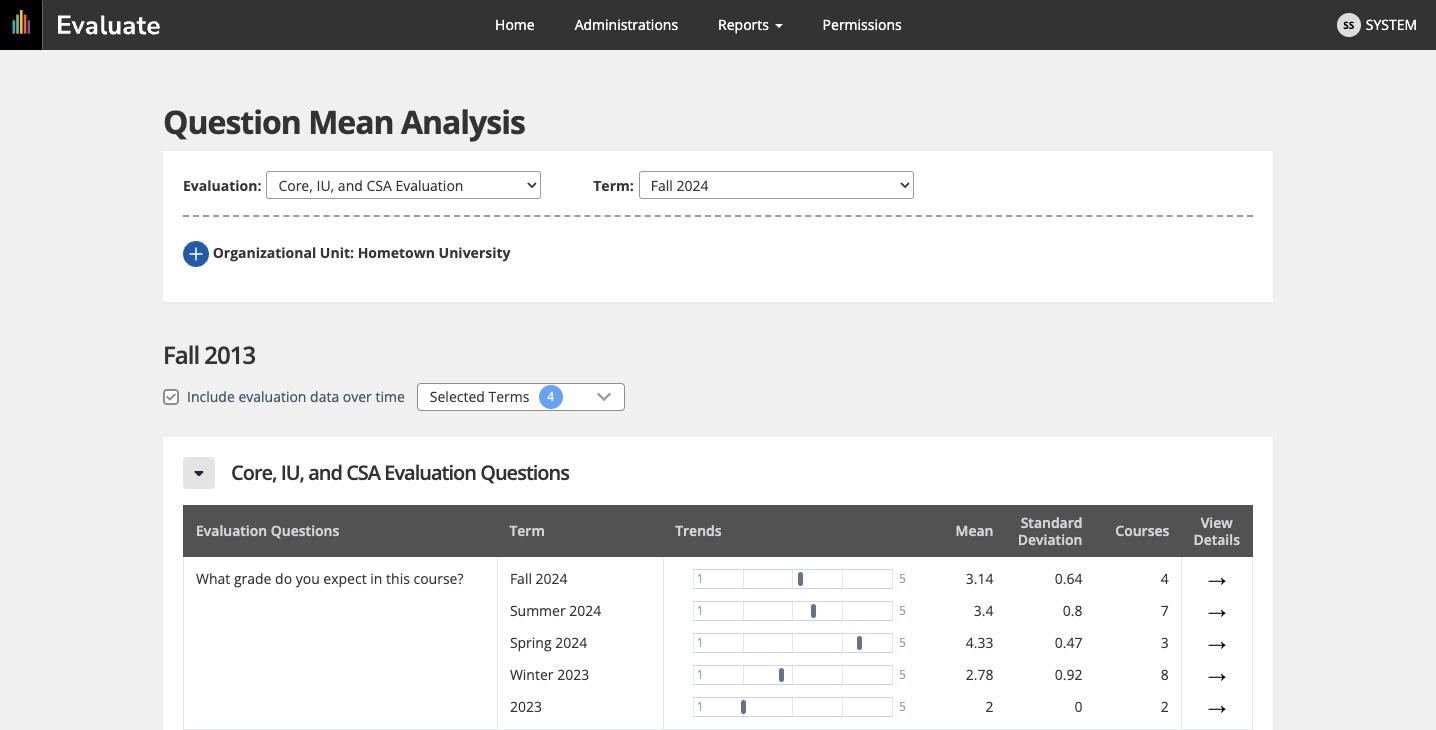
The Question Mean Analysis report has been expanded to include a new longitudinal data feature which allows users to include evaluation data over time compared to their selected evaluation and term.This enhancement enables a more comprehensive analysis of unit performance, providing a deeper understanding of performance trends over time.
 |
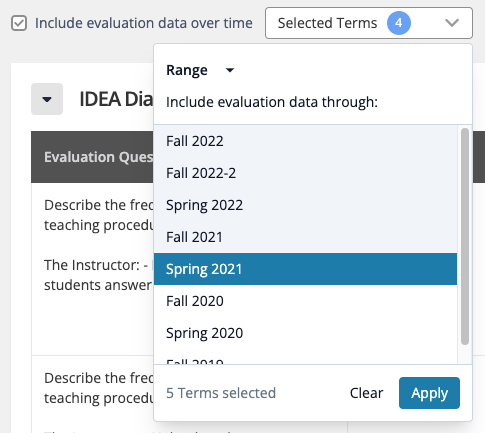
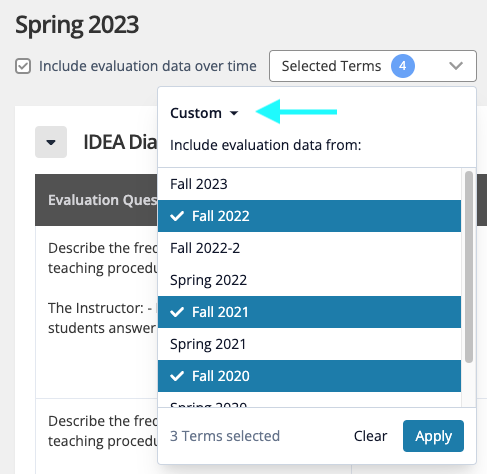
This new feature can be enabled by selecting the "Include evaluation data over time" checkbox. Once enabled, users can begin adding additional term data to the data table by utilizing the range or custom select term picker.
The "Range" selector allows users to include historical data through a specified term end point. Selecting a term from this list will include all terms included in the range.

In more specific use-cases, change the dropdown option to "Custom" to select specific terms for inclusion.

This enhancement involves a number of visual changes to the existing Question Mean Analysis page. We've included a Trends graph to help visualize the Mean score when viewing a single term or results over time. When looking at an individual term or terms over time, the Mean, Standard Deviation and number of Courses will be displayed with the ability to click on the corresponding arrow under the View Details column to drill into the specific course/instructor details for each term.
Once clicked, the Question Mean Details page displays with a list of each course/instructor and the individual mean for that question.
Helpful Resources
Be sure to check these sites for additional information related to this:
Learn more about utilizing this new feature by visiting our Question Mean Analysis support documentation.
Questions? For assistance contact Anthology Support at here