Instructor Feedback Launches
The Instructor Feedback Launches worksheet shows instructor feedback engagement and distribution over a certain date range.
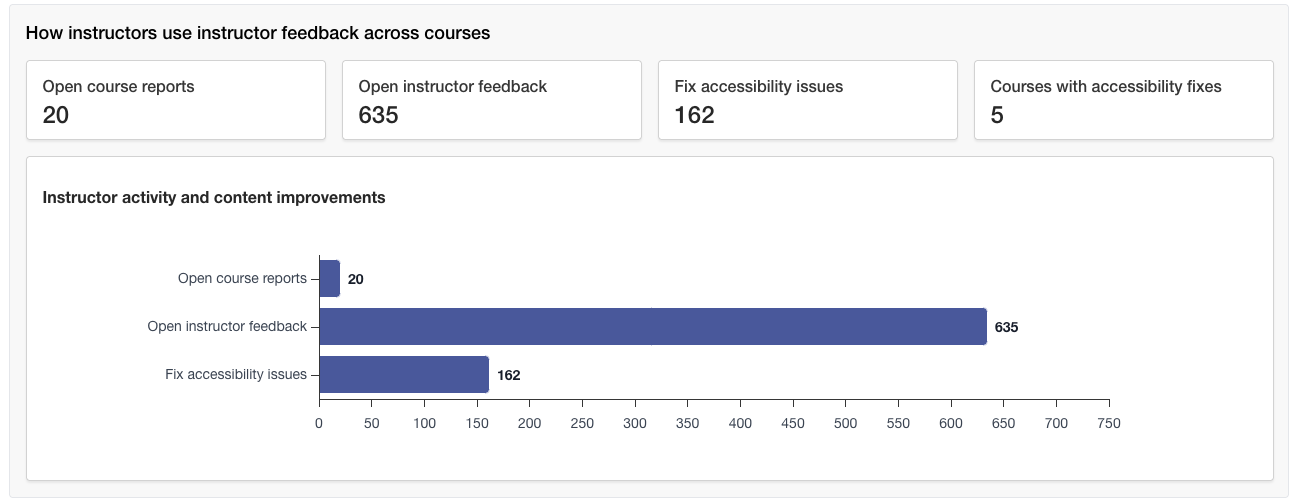
Engagement with Instructor Feedback
The report starts with details on how many times the instructor feedback panel was opened and how often instructors fixed an accessibility issue as a result.
The report also shows how many times a Course Accessibility Report was was opened from a course.
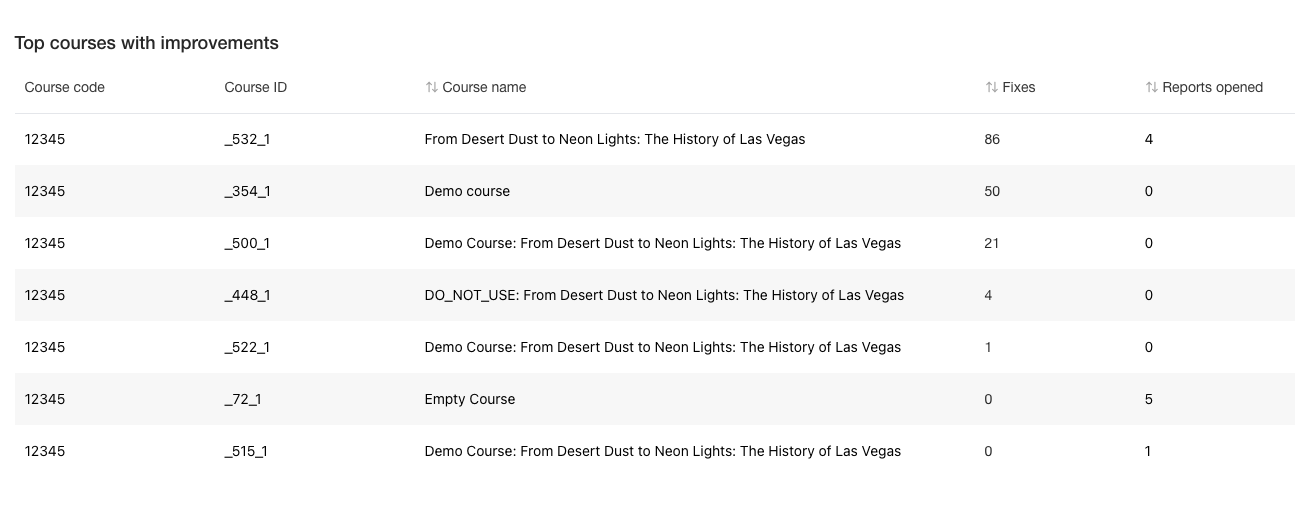
Courses that made improvements
See the courses instructors fixed accessibility issues in.
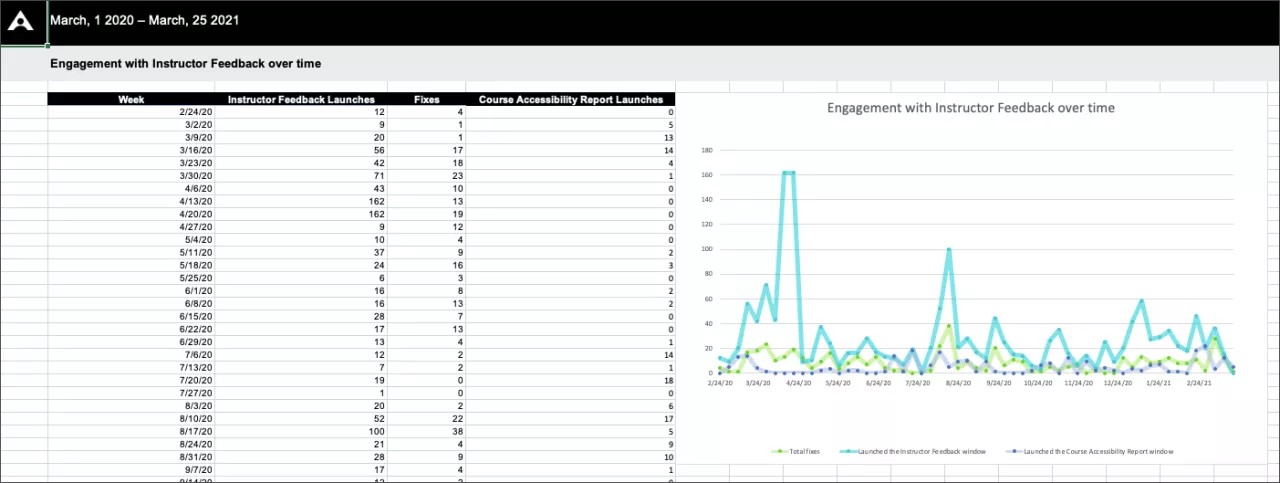
Instructor Feedback Weekly
The Instructor Feedback Weekly worksheet shows weekly activity over the report's date range. You can see how many times instructors opened the instructor feedback panel and Course Accessibility Report each week. You can also see how many times they fixed accessibility issues each week.
Tip
Weeks start on Mondays. You can't report on the current day.