Ally Adoption Strategy Guide
The Ally Adoption Strategy Guide is designed to help institutions successfully revisit and strengthen their Ally adoption strategy. This guide provides administrators with a structured framework for revisiting targeted areas within an adoption strategy, leveraging Ally’s Institutional Report.
Section 1: SWOT Analysis
Section 2: Goal Settings
Section 3: Strategy Crafting
Section 4: Communication Plan
Section 5: Evaluate and Iterate
Section 1: SWOT Analysis
This section of the strategy is a crucial first step in determining where to begin with your Ally adoption strategy. A SWOT (Strengths, Weaknesses, Opportunities, and Threats) analysis helps institutions identify key data points that highlight accessibility trends, areas for improvement, and potential opportunities for engagement. The SWOT analysis consists two parts: quantitative data and qualitative data, allowing administrators to consider the big picture before formulating a plan.
Recommended time frame: This depends on where you are in your Ally journey. For more advanced institutions, perhaps the last 1-2 years. For institutions new to Ally, work with the data they have OR skip step 1.
Quantitative
The first part of the SWOT analysis will focus on the quantitative data you have collected via Ally’s institutional report. By using key data points, such as overall accessibility scores, specific issues that repeatedly show up in courses, and usage data, we will leverage the data Ally has already been collecting. More specifically, we will look at the following data points from your institutional report: overall score, accessibility issue severity, course-level data, directory, usage data, and CSV Export.
Use the following data points and accompanying screenshots to help you complete your SWOT analysis of your quantitative Ally data. Each subsection will have a series of questions, organized by strengths, weaknesses, opportunities, or threats, for consideration.
Overall Score
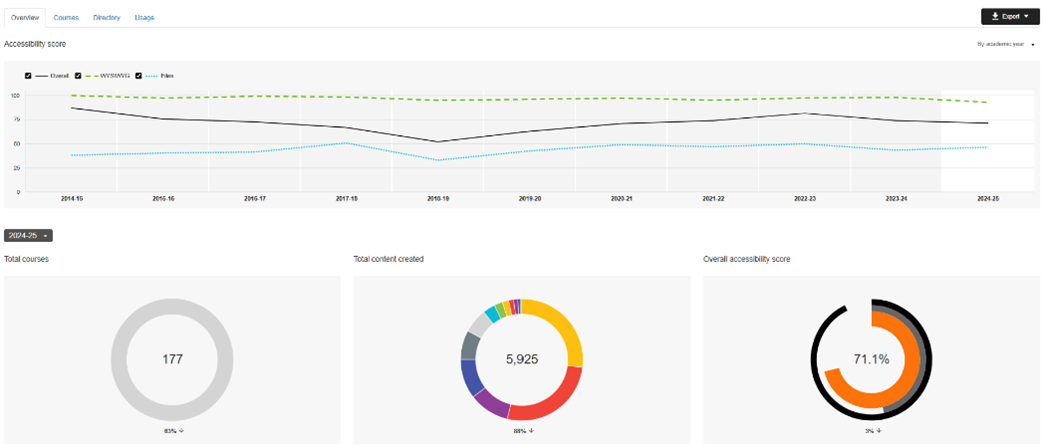
For your SWOT analysis, consider the following questions pertaining to your overall score.
Strengths
Has your WYSIWYG overall score remained consistently high over the last year? Or perhaps the overall score for files?
How has your overall score changed over the last 2 terms? Last 2 years?
Are you surprised by this score?
Weaknesses
Is there a lack of an overarching strategy or policy, training, or support resources that could improve the score?
Has your score decreased, even marginally, in the last academic year? Or from the last term?
Opportunities
Is there an ideal overall accessibility score you’d like to see your institution achieve?
What quick wins (e.g., remediation of high-impact content, training and/or awareness campaigns) could raise the score in the short term?
Threats
Are there time, staffing, or budget constraints that could hinder initiatives to improving the overall score?
Are there gaps in how using Ally is communicated with instructors?
Accessibility Issues by Severity
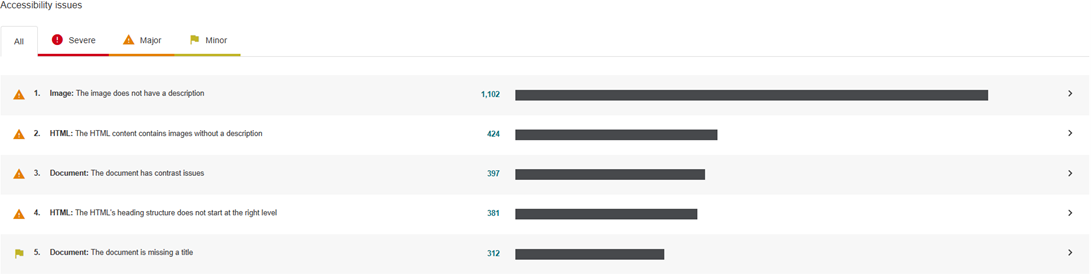
For your SWOT analysis, consider the following questions pertaining to your accessibility issue by order of severity.
Strengths
Have you noticed a significant decrease in the number of content items that have a specific issue? For example, in the last term, there were at least 1,000 more content items that had insufficient contras.
Does the data highlight instructors or units already adoption accessibility best practices?
Weaknesses
What are the top five issues found in your data? Top 10 issues?
Are there persistent issues that have not improved over time?
Opportunities
How many of these issues would be considered easy to remediate for instructors? For example, images missing a description or contrast issues?
Of those top 5 or even top 10 accessibility issues, are there existing resources that can support instructors in addressing them? For example, if one of the top issues was missing image descriptions, does your institution already have training materials or resources that focus solely on this particular issue?
Threats
Of the top 5 or even top 10 accessibility issues, how many will be more complicated for instructors to remediate? A good example is PDFs-many instructors do not have access to Adobe Acrobat Pro, preventing them from addressing accessibility issues detected.
Are there persistent issues, such as scanned PDFs or heading structure, that stay consistent in volume, or even increase?
Course-Level
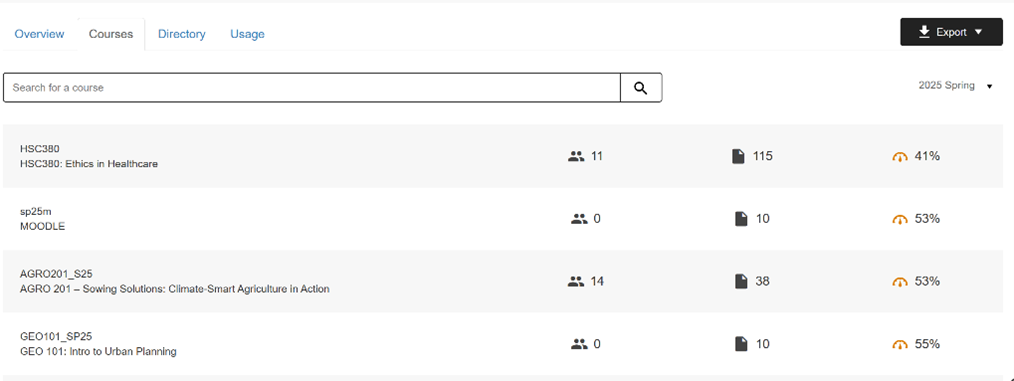
For your SWOT analysis, consider the following questions pertaining to your courses data.
Strengths
Are there content types across most courses that consistently have no or low-severity issues?
Are there specific courses that consistently have high accessibility scores and could serve as a positive example/use case to others?
Weaknesses
Which areas of the institution (departments or colleges) have the lowest scores?
How many courses have scores below 50% What commonalities exist among those courses?
Opportunities
Are there specific courses that consistently have high accessibility scores and could serve as a positive example/use case to others?
What file types or issues appear most frequently across courses?
Threats
Are there high enrollment courses that have scores below 66%, or in the medium range?
How many courses have scores below 50%? What commonalities exist among those courses?
Directory
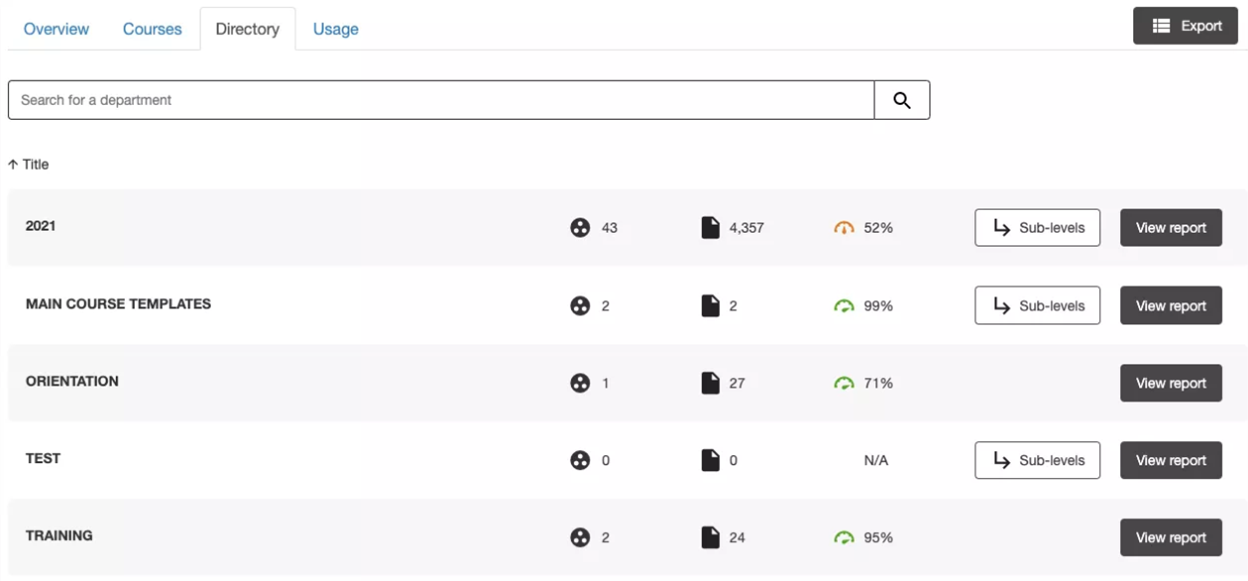
For your SWOT analysis, consider the following questions pertaining to your courses data.
Strengths
Which departments consistently have high accessibility scores?
Are there departments that have shown significant improvement over time?
Weaknesses
Which departments have persistently low accessibility scores?
How many courses have scores below 50% What commonalities exist among those courses?
Opportunities
Are there departments that have lower scores that have expressed the need for more support and/or intervention?
Are there specific departments with higher scores and/or identified accessibility champions that would be willing to mentor and/or support departments with lower scores?
Threats
Are there systemic issues (e.g. lack of training or resources, inaccessible course shells) that could impact multiple departments?
Are there high-enrollment departments with low scores that may disproportionately affect a larger number of students?
Usage Data
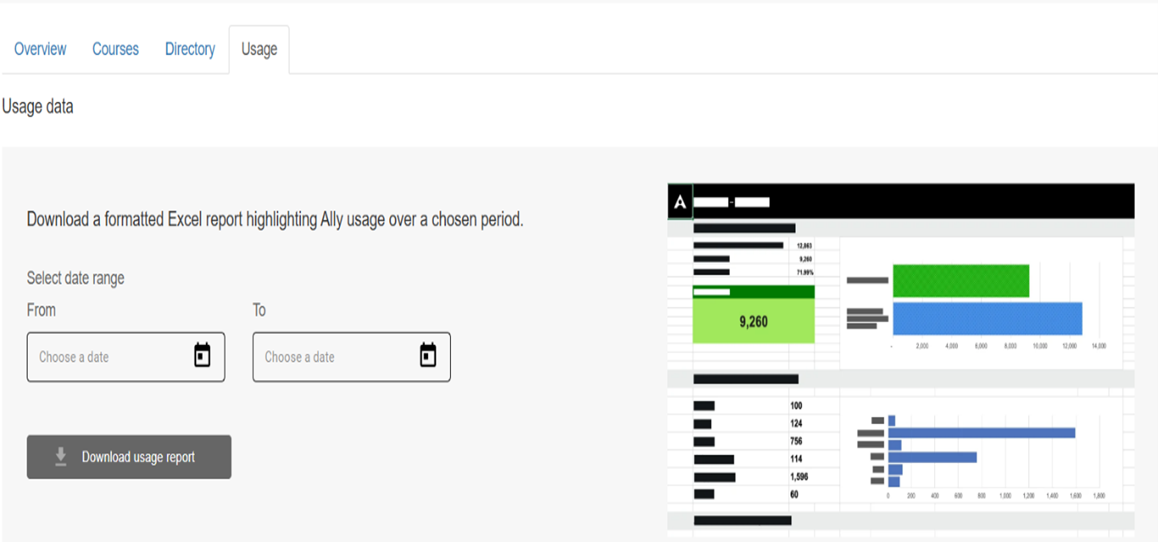
To narrow your SWOT analysis of usage data in time and scope, consider pulling the data from the past year and or start of the most recent academic term.
For your SWOT analysis, consider the following questions pertaining to your courses data.
Strengths
Is the conversion rate from alternative formats to those downloaded above 60%? Similar, is the conversation from instructor feedback launches to fixes above 60%?
Do certain types of alternative format show consistent, high usage?
Weaknesses
How strong is your conversation rate for instructors opening the Instructor Feedback panel and then also making fixes to their content? Is there room for improvement?
Do some alternative formats show little to no usage, indicating lack of awareness?
Opportunities
For alternative format types with low download numbers, are there opportunities to boost communication with students about their purposes and benefits?
For courses with high fixes to content using the instructor feedback feature, is there an opportunity to have the instructors talk about their experiences with their peers?
Threats
Are there specific courses with little to no usage of Ally (both in terms of the alternative formats and instructor feedback)?
For courses with little to no usage of Ally, are there known barriers preventing faculty and students from using Ally more?
Qualitative, Anecdotal, or Conversational
This section is not necessarily as quantifiable as the preceding section, but important, nonetheless. Here you will review any qualitative data collected on the usage of Ally at your institution, but also anecdotal or conversational feedback you may have had with faculty or students.
Gather the following qualitative data points for this section of your SWOT analysis:
Survey data
Course evaluations
Workshops, trainings, webinars, office hours that focused on Ally or accessibility
Informal conversations with faculty, students, or staff
Faculty senate meetings
Now that you have gathered any pertinent qualitative or anecdotal/conversational data, consider the following questions:
Strengths
What positive themes or patterns are emerging in your qualitative feedback?
In more informal conversations, are accessibility and Ally being framed positively as part of inclusive teaching?
Do instructors or students express a growing awareness of Ally in either surveys or course evaluations?
Are students sharing that alternative formats are supporting their learning needs and/or preferences?
Weaknesses
What overarching challenges or concerns are surfacing in your qualitative feedback?
Are instructors expressing any confusion, frustration, or fatigue related to Ally or accessibility expectations?
Is accessibility seen as an afterthought or as someone else’s job rather than being a collective effort involving everyone?
Are there signs that students either don’t understand or are unaware of what alternative formats are and how they can be used?
Opportunities
What qualitative insights could be leveraged for deeper impact?
Are there specific needs or requests identified from faculty that could help them use Ally more?
Is there enough strong anecdotal feedback to be turned into case studies, testimonials, or faculty spotlights?
Are there common pain points or issues that, if addressed, could greatly improve perception and usage?
Threats
What risks or barriers can be identified from your qualitative data?
Do recurring concerns in evaluations or surveys suggest a lack of trust or buy-in?
Are some groups (adjuncts, grad instructors, certain departments) consistently underrepresented in accessibility conversations?
Is there resistance to accessibility efforts?
Section 2: Goal Setting
Before building out your adoption strategy for Ally, it’s essential to identify clear goals based on your Ally data and SWOT analysis that ultimately serve as the foundation for a focused, effective adoption strategy. This section guides institutions in translating insights from their Ally data and SWOT analysis into clear, achievable goals that support long-term improvements in digital accessibility.
We’ve intentionally placed this section before strategy to emphasize that strong goals should guide the direction and design of your overall approach to Ally adoption. The components of this section include the following translating SWOT findings into actional goals and goal setting.
Translating SWOT Findings into Actionable Goals
With your SWOT analysis of your Ally data complete, it’s time to develop focused goals that build on your findings, ensuring your strategy is both data-driven and aligned with institutional priorities.
Each element of your SWOT analysis provides valuable guidance for setting strategic goals:
Strengths → Maintain and Scale Success Identify what is already working well and find ways to expand, replicate, or leverage these strengths.
Example: If faculty engagement is strong in some departments, contact those department chairs to identify their accessibility champions. Perhaps they would be willing to speak with other departments and share what has worked well for them.
Weaknesses → Address Key Gaps Areas of weakness highlight challenges that need to be resolved for greater impact.
Example: If faculty are struggling to interpret Ally’s feedback and guidance, create targeted training or quick-reference guides. Alternatively, you could schedule a focused working session where instructors can bring their own computers and work on remediating their own content. An internal Ally expert can be there to answer questions and support the collective group.
Opportunities → Leverage for Growth External or internal opportunities can be harnessed to expand accessibility efforts.
Example: If new accessibility policies or leadership initiatives are emerging, align Ally adoption with these institutional priorities.
Threats → Mitigate Risks Identify potential roadblocks and develop proactive strategies to minimize them.
Example: If there is resistance to accessibility improvements due to workload concerns, emphasize time-saving aspects of and provide streamlined resources.
Establish SMART Goals Based on SWOT Insights
For each identified priority, set SMART goals (Specific, Measurable, Achievable, Relevant, and Time-Bound). Here’s how this approach works:
SWOT Analysis | SMART Goal Example |
|---|---|
Strength: High alternative format usage by students | Increase awareness by launching a student-facing campaign with resources and testimonials by the end of the semester. |
Weakness: Low conversion rate from instructor feedback launches to fixes | Implement targeted training sessions for courses under a certain conversion threshold, focusing on the most common accessibility issues in course content. |
Opportunity: Strong institutional accessibility initiatives and leadership support | Ask individual academic leaders that support accessibility to speak at department or division meetings to encourage instructor engagement and offer suggestions or best practices. |
Threat: Limited leadership buy-in on accessibility | Present an Ally impact report to leadership within the next quarter, including data on accessibility improvements and student benefits. |
Use your Ally data to pinpoint specific accessibility challenges and opportunities:
Low Accessibility Scores: Identify courses or content types (e.g., PDFs, images, documents) with the lowest scores.
Alternative Format Usage: Assess how students are using alternative formats and identify ways to increase awareness.
Faculty Engagement: Determine if instructors are actively using Ally’s feedback and where additional training is needed.
Goal Setting
Using the suggestions and information above, now is the time to set your goals based on your SWOT findings and any institutional priorities. Below, you will find two tables to support your goal-setting efforts. The first includes examples of each column to be used as inspiration for setting your own goals. The second is a blank template for you to use in identifying your own goals. The focus areas correlate to the different groups of data Ally provides, as explored in the SWOT analysis of this strategy guide. Feel free to add any other focus areas that were not mentioned but are relevant to your institution.
Download an example Goal Setting spreadsheet.
Focus Area | SMART Goal | Milestones | Due Date | Responsible Party | Check-in Plan |
|---|---|---|---|---|---|
Overall Score | |||||
Accessibility Issues by Severity | |||||
Course-Level Data | |||||
Directory | |||||
Usage Data | |||||
Qualitative Data |
Section 3: Strategy Building
With clear goals in place, you can now build a targeted strategy to guide your Ally adoption efforts. Your strategy should outline focus areas, goals and their accompanying milestones, responsible party, metrics for success, and check-in plan. To provide some specific examples of what to include in your strategy, see the first strategy template below. It contains one fully completed example row, followed by additional considerations to help guide your selection of focus areas. A blank strategy table is also included, allowing you to customize it to reflect the specific needs and priorities of your institution.
Focus Area | Goal | Milestones | Timeline | Responsible Party | Required Resources | Check-In Plan |
|---|---|---|---|---|---|---|
Content Remediations | Increase # of instructors actively remediating digital course content in Ally by 25% semester, through targeted training sessions, resource guides, and monthly progress reports. | -Announce to faculty via email and internal channels and set baseline metrics -deliver targeted trainings and instructor guides -review progress and share out; use data to guide additional efforts -final comm. push | End of Fall 2025 | -deans and dep’t chairs -faculty champions | -Targeted trainings -instructor guide -comm. templates | -monthly progress reports to dep’t chairs -newsletters -announce at dep’t meetings |
Communication with Students | Increase faculty comm. Efforts w/ students through consistent faculty messaging | -by end of Fall 2025 semester, 80% of faculty in participating departs will send at least 2 Ally-related comms (e.g., syllabus statement, announcement, or email) to their students, promoting the use of Ally and explaining its benefits. faculty to use in their outreach to students | -Fall 2025 semester | -Dep’t chairs and deans | -syllabus statement -Ally alt format demonstration recording -Messaging templates -Ally resources | -monthly check-ins with dep’t heads or liaisons -mid-semester pulse survey -Ally admin to review usage data for potential increases in faculty and student usage of Ally |
Instructor content Fixes and Scores | By end of fall 2025, all courses will be at a minimum Ally score of 75% | -use Course Accessibility Report to identify top 3 issues -create and disperse instructor remediation guides -host 2 hands-on remediation workshops or office hours -track fixes via Ally’s Institutional Report (usage data) | Fall 2025 | -instructional designers, accessibility coordinator, dep’t chairs | -directory access for dep’t heads, remediation guides, workshop materials | -monthly review of Ally reports -mid-semester faculty survey -end of term summary report including increases and most improved courses/faculty |
Additional focus areas for consideration:
Student awareness and empowerment
Stakeholder engagement
Culture and awareness
Faculty development and support
Celebrating faculty improvement
Student feedback
Focus Area | Goal | Milestones | Timeline | Responsible Party | Required Resources | Check-In Plan |
|---|---|---|---|---|---|---|
Section 4: Communication Plan
The communication plan is a critical component of a successful Ally adoption strategy as it ensures that key stakeholders—including faculty, instructional designers, administrators, and students—understand the purpose, benefits, and best practices for using Ally. This plan outlines how to share information, drive engagement, and maintain ongoing accessibility awareness across the entire institution.
With your goals identified and strategy defined, now you need to communicate to all necessary parties the what, the who, and the why.
The what speaks to what Ally is and how it fits in with your adoption goals.
Think of how you would define or describe Ally to others? Use the following example to suit your preferences and context: Ally is a digital accessibility tool embedded in your Learning Management System (e.g. Blackboard, Canvas, D2L Brightspace, or Moodle), designed to help make digital course content more accessible and inclusive.
If you’d like the definition to mention the user groups Ally supports, or what the core features are, consider the following expanded definition.
What key words do you include in that definition or description?
What are the key features or functionalities?
The who is to identify those responsible for implementing certain parts of the communication plan. It can be helpful to create a chart or table that states who is responsible for what component and share that out. Use the following questions to help determine who will be responsible for which communication component.
Who can influence senior academic leadership or key departments?
Who has the bandwidth to take on this responsibility?
The why speaks to the more short term goals have been implemented, such as improving the overall accessibility score at your institution. But it also addresses the big picture reason or long term goals for why we do any of this-to provide an accessible and inclusive learning environment that welcomes and supports all students.
Short term: to engage the institutional community, share the most pressing short-term goals, such as increase overall score by 10 points.
Long term: the big picture, or long-term goal for using a tool like Ally should be incorporated into all Ally-related messaging. Emphasize the commitment to accessibility as being the right thing to do, always.
Stakeholder Group (target audience) | Key Message | Message Medium | Message Cadence | Message Sender |
|---|---|---|---|---|
Faculty and Instructors | How Ally helps improve course accessibility and enhances student learning. | Email newsletters, faculty workshops, LMS announcements, department meetings, quick-reference guides. | ||
Instructional Designers and IT Staff | How Ally integrates into existing systems and supports accessibility initiatives. | Training sessions, knowledge base articles, Slack/Teams channels, office hours. | ||
Administrators and Leadership | How Ally aligns with institutional goals for accessibility, DEI, and compliance. | Reports with key metrics, executive briefings, department meetings. | ||
Students | How to use alternative formats for personalized learning experiences. | Social media, student newsletters, in-class demonstrations, orientation materials. |
Section 5: Evaluate and Iterate
The purpose of this section is to evaluate the success of your Ally adoption strategy, report on progress, and iterate.
A successful Ally adoption strategy is not static—it requires regular evaluation and adjustment. This section supports administrators in evaluating how well identified goals and milestones have been met, sharing outcomes and progress with stakeholders, and celebrating successes. Just as importantly, you will use insights gleaned from completing previous sections of this strategy guide to identify areas needing adjustment and modification.
Administrators will find suggestions for setting review timelines, collecting feedback from key stakeholders (including faculty, students, and support staff), and using data from Ally reports and engagement metrics. The goal is to create a continuous improvement cycle that strengthens both accessibility outcomes and overall user experience.
Just as the SWOT analysis in this adoption strategy was organized, we will review both your quantitative and qualitative data to gauge the effectiveness of the implementation of your adoption strategy.
Data Review
Use your goals set out in sections 2 (goals) and 3 (strategy building) and to determine progress made. Keep in mind that it is important to track your progress throughout your determined timeline, so having that data at the ready will be an important part of this review. Below, you will find 4 example goals, organized into data categories of quantitative or qualitative, all from either the goals or strategy section of this guide.
Goal (Quantitative or Qualitative) | Progress over time | Communication with Stakeholders | Notes |
|---|---|---|---|
(Quant.): Raise the overall institutional score from 66% to 75% by the end of the academic year. | -August 15: 66% -September 30: 69% -October 30: 71% -December 20: 73% | -August 15: Starting score shared with senior leaders, dept’ heads and deans during back to school meetings -September 30: progress dashboards created and first round shared with senior leaders -October 30: progress dashboards shared with senior leaders via email -December 20: ending score and progress dashboards shared with senior leaders | We were 2 points shy of achieving our goal. Will bulk up communication efforts to faculty and dep’t heads and deans throughout the semester, offer more trainings and resources, and replicate our efforts for the spring semester. Will consider gamification amongst departments if spring progress is not strong. |
(Quant.): Reduce the top 3 severe issues by 50% by end of semester | -August 15: issue #1 missing alt text (16,789), issue #2 insufficient color contrast (14,349), issue #3 missing headings (14,000) -September 15: issue #1 (15,679), issue #2 ( 13,200), issue #3 (12,000) -September 25: issue #1 (14,200), issue #2 (10,546), issue #3 (9,234) -October: issue #1 (13,100), issue #2 (9,456), issue #3: 8,201) -November: issue #1 (12,034), issue #2 (9,432), issue #3 (7,943) -December: issue #1 (10,456), issue #2 (8,011), issue #3 (6,455) | -August 25: identify top 3 severe issues in IR and share out via progress dashboard -Sept. 15-Sept. 25, and every month after that | End Scores: Issue #1: 16,789-10,456 Issue #2: 14,349-8,011 Issue #3: 14,000-6,455 -Decrease was 44.79%!!! So close to achieving the goal! |
(Quant): Increase instructor fixes by 15% by end of semester | -Aug. 15: total # of fixes 64 -Sept. 15: total # of fixes 140 -Oct. 15: total # of fixes 188 -Nov. 15: total # of fixes 212 -Dec. 15: total # of fixes 258 | -August 15: -Sept. 15 -Oct. 15 -Nov. 15 -Dec. 15 | Percentage increase is over 300%! Excellent! Share via progress reports and celebrate the win. |
Report on Progress
Here we provide guidance for administrators on how to effectively track, evaluate, and communicate progress toward their identified ally adoption goals. Acknowledging that each institution operates within its own data infrastructure and reporting culture, this section encourages a flexible approach that aligns with existing data processes. Whether through dashboards, scorecards, or user stories, this section explores different means of sharing progress on goals with the larger institutional community.
To provide flexibility in how you report out your progress, consider the following methods.
Progress dashboards: create visual dashboards showing key metrics (overall Ally score, increase in instructor fixes, etc.) using tools like Power BI, Tableau, or Excel.
Progress reports: structured written update summarizing quantitative data (consider incorporating progress dashboards) and qualitative insights; include charts, tables, and written summaries of progress and any pertinent details. Could be shared in meetings, newsletters, email listservs, etc.
Scorecard: simple table or matrix showing each goal, current status, and next steps.
User stories: collect testimonials from faculty and/or students to highlight how Ally has helped them achieve the identified goal, share in reports or presentations with larger institutional community.
Stakeholder briefings: to demonstrate return on investment and progress on goals, provide briefings during designated meeting times (or schedule a meeting if possible), present data, highlight wins, and acknowledge and challenges.
Iterate
A sustainable adoption strategy is more than a one-time rollout- it demands continuous reflection, adaptation, and growth. The final portion of this adoption strategy guide focuses on iterating what worked and tweaking what needs improvement. Consider the following suggestions as part of your iteration approach to your Ally adoption strategy.
Keep a growth mindset-mistakes will be made and frustration may occur but remember that accessibility is about progress over perfection.
Use data to drive efforts and adjustments. The usage data in your Institutional Report is a data gem: use that to help evaluate goal progress.
Schedule regular reviews of goal progress and take notes to reflect on at end of strategy cycle and to help determine what to replicate and what to modify.
Align with institutional shifts: perhaps there are other institutional initiatives underway that may impact your strategy, find a way to make Ally adoption work with those initiatives to ensure collaboration and buy-in.
Analyze what worked and what didn’t and consider all factors.
Ideally, you should revise your Ally adoption strategy each academic year to ensure effectiveness, ingenuity, and success.
Creating and implementing an adoption strategy for Ally at your institution or organization is a critical component of advancing digital accessibility and fostering a more inclusive teaching and learning environment that supports all learners. It requires thoughtful planning, cross-functional collaboration, and a willingness to evolve alongside the needs of students, faculty, and staff. This guide has provided a strategic foundation for administrators to lead that journey—by setting measurable goals, monitoring progress, and iterating with purpose.
As you implement and refine your Ally adoption strategy, remember that success is not defined by a single milestone, but by the ongoing commitment to accessibility and continuous improvement. Your leadership is essential in embedding Ally into institutional culture—not just as a tool, but as a catalyst for change.