Student Summary Report
The Student Summary Report provides detailed and actionable information about a single student across all their courses.
Note
Some terms in this report are explained in our Glossary.
Data Source: Blackboard
Use Controls
In contrast to other reports, this one isn't pre-filtered; it's set up for you to create a student-focused report. You just need to select the filters to specify the particular student you want to review and the specific timeframe activity.
You can choose to view the student's activity using:
Show Activity within filter, which allows you to:
View all student activity
Open the possibility of choosing a specific date range
Note
When you select a specific date range, that timeframe only applies to visualizations marked with this icon: 🗓️
Show Courses within Terms filter, which lists only the terms associated with courses the specific student is enrolled in. This would filter all visualizations to include only data from courses in the selected term(s).
Find detailed descriptions of each control in the Controls section of our Glossary
Overview tab
Summarizes the overall student activity over time. Use the filters above to display all student’s activity or within a specific date range.
Some of the key data points in this tab:
Time in courses compared to peers
Type of accommodations
Alternative Formats usage
Submissions status in all courses
Notes for this tab:
Send an email: you can use the email link on the Student Email row (in the Student Information table) to email a student. Once you select the email link, you'll be redirected to your predetermined email configuration.
In the heatmap about access frequency:
See the total number of accesses throughout the timeframe you've selected and for each day of the week in two-hour increments.
Darker blue shades indicate greater activity during that timeframe, using the institution's time zone.
When a day is missing, it means no student activity in the LMS.
Engagement and Performance tab
Identify how the student engages with courses and how performance on grades correlates with the type of activity. Student engagement and performance compared to peers are based only on courses the student is enrolled in and has in common with their peers.
Some of the key data points in this tab:
Participation rate compared to peers
Level of engagement (item accesses) compared to peers
Timeliness in completing assessments
Activity and performance (grades) in each course compared to peers
Detailed progress per course and per assessment
Notes for this tab:
Assessments include anything that needs grading and has a due date: assignments, tests, surveys, or even discussions, blogs, and journals.
In the last table about How's the student engagement and performance per course:
Assessment progress is measured by the percentage of assessments with submissions vs. the assessment total count.
The table top displays columns' totals: a sum when the column shows absolute numbers and an average when the column shows percentages.
Student’s time spent in course, total submissions, and total interactions metrics are based on quartiles. Quartiles can be identified by:
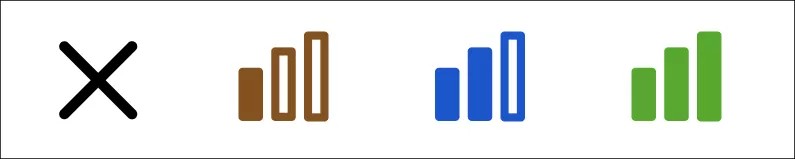
X: first quartile
I: second quartile
II: third quartile
III: fourth quartile
Activity Log tab
Provides a detailed view of the student’s granular activity within a specific timeframe, including course and activity type (such as submissions), allowing you to identify patterns and identify changes over time and troubleshoot issues.
Some of the key data points in this tab:
Activity by event type (accesses, submissions, clicks)
Activity over time
Activity log
Note for this tab:
Event Type Filter: On this tab you can choose to display data only related to one event type:
Course access
Item access
Login
Logout
Submission
Total Access
Ultra click