Apply Visual Filters to Reports
Note
Denna dokumentation har översatts med hjälp av AI-stödd maskinöversättning. Översättningarna tillhandahålls ”i befintligt skick” utan någon garanti för deras riktighet. Den engelska versionen av detta innehåll är den officiella och giltiga källan.
Visual filtering allows you to filter course and student data by selecting categories in other data visualizations in the same report tab.
Select a category in any data visualization inside the report tab you want to filter course and student data.
The selected category will be highlighted.
Go to the course and student data to see it filtered by your selected category.
Review and delete visual filters
A combination of visual filters can result in no data displaying. You can remove a visual filter to return data to the report.
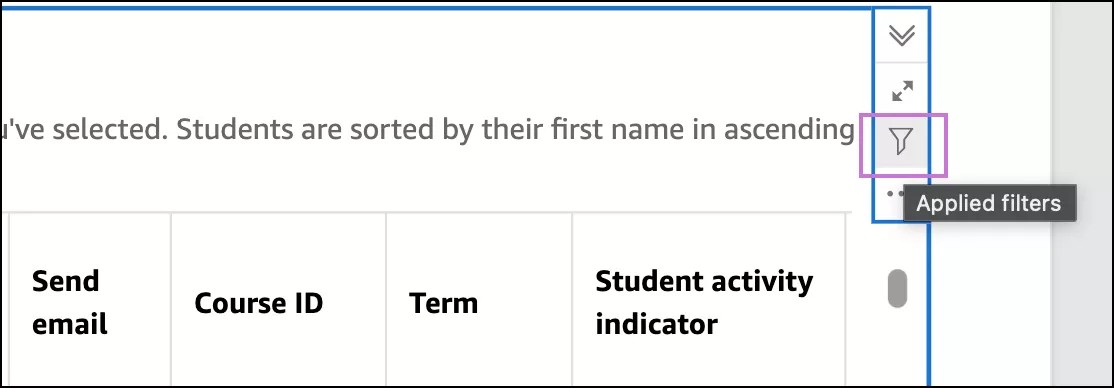
Select the chart or table you want to review or delete the visual filters from.
In the option menu, select the filter button.
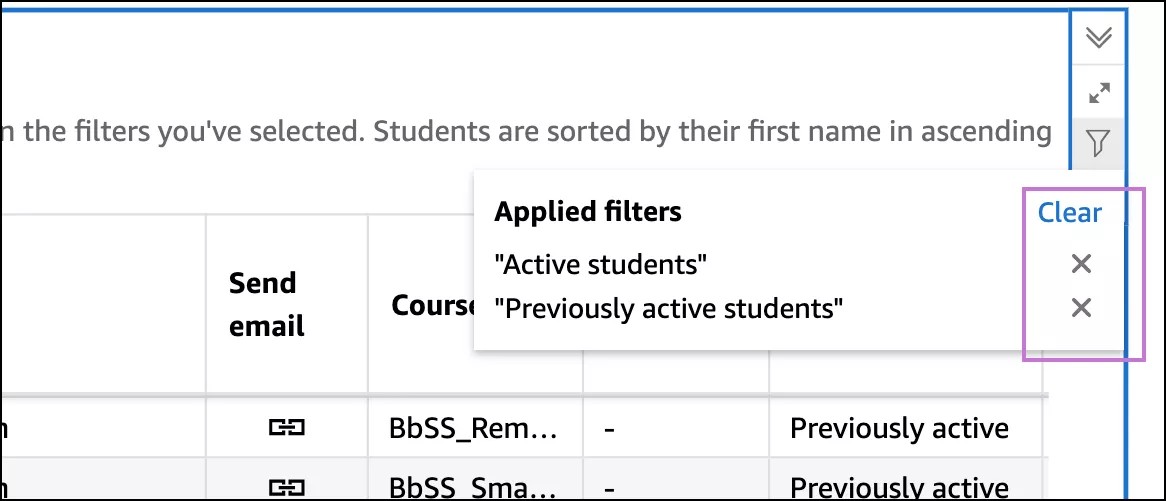
Select the Remove button next to the filter you want to remove.
Or, to clear all applied visual filters at one time, select Clear.
Maximize or minimize data visualizations
Inside a report tab, select the data visualization you want to maximize.
Select the Maximize button.
To minimize the visualization, select the Minimize button.