Ally Accessibility Report Overview
The overview shows you how content on your site is performing by month or year. It shows you the overall accessibility score, the total number of domains and content, as well as accessibility issues found.
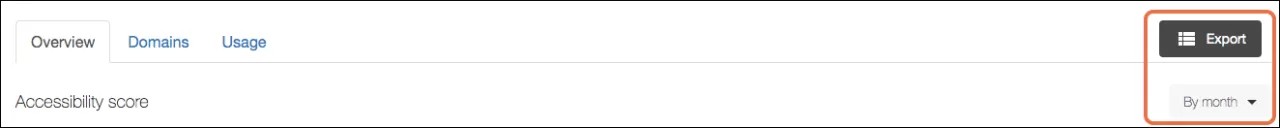
Use the period type menu to view the report by month or year. Export the report for more details.
Accessibility score
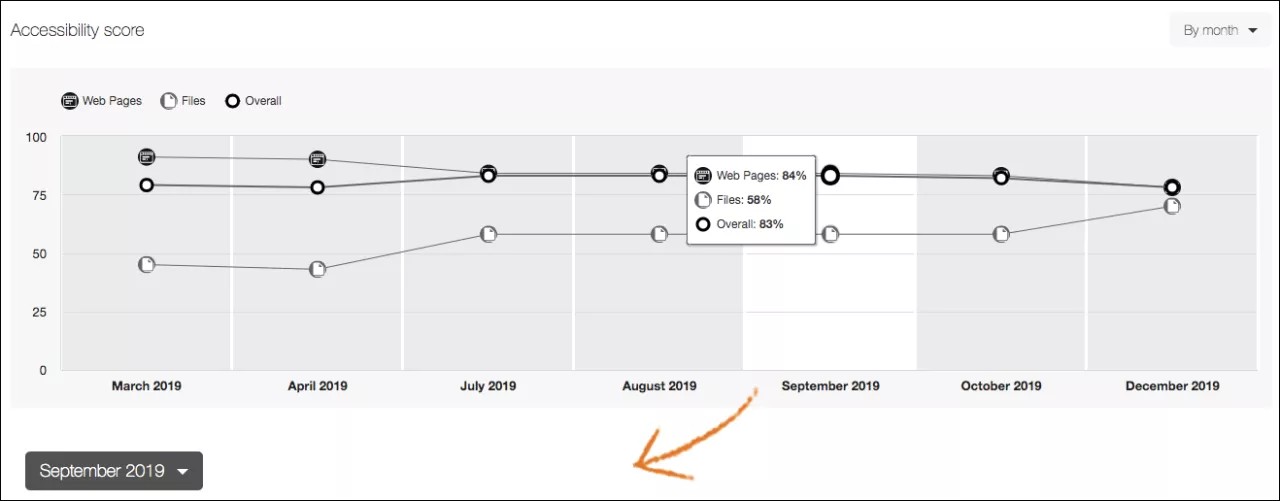
This line graph shows the accessibility score for all content over a select period of time. For example, if you select By month in the period type menu, you can compare performance over many months.
Year accessibility score: The average of the accessibility scores of all content items in that calendar year.
Tip
If you are using Web Community Manager this is an academic year.
Month accessibility score: The average of the accessibility scores of all content items in that month.
The higher the score the better your content is performing. Point to a period on the line graph to see the scores.
Web Pages: The average score for the website’s pages.
Files: The average score for uploaded file content. For example, PDFs, Word documents, PowerPoint presentations, images, and so on.
Overall: The combined accessibility score is a weighted average of scores from files and web pages scores.
Select a period to view more details for that period in the Total domains, Total files, Total pages, Overall accessibility score, and Accessibility issues reports. You can also select a new period in the current period menu.
Tip
With your keyboard, press Tab to navigate through each period on the graph. Press Spacebar to select it.
Total domains, web pages, and files
View the total number of files on your site in the Total files report. View the number of domains and web pages on your site in the Total domains and Total pages reports. The Total domains report compares the current period to the period before.
In the Total files report, uses color to represent different file types. Point to a type to see the total number uploaded and an accessibility score for that type.
Tip
Screen reader users can press Tab to move through the hidden Total files table.
Select a new period from the Accessibility score line graph or current period menu to view a different period.
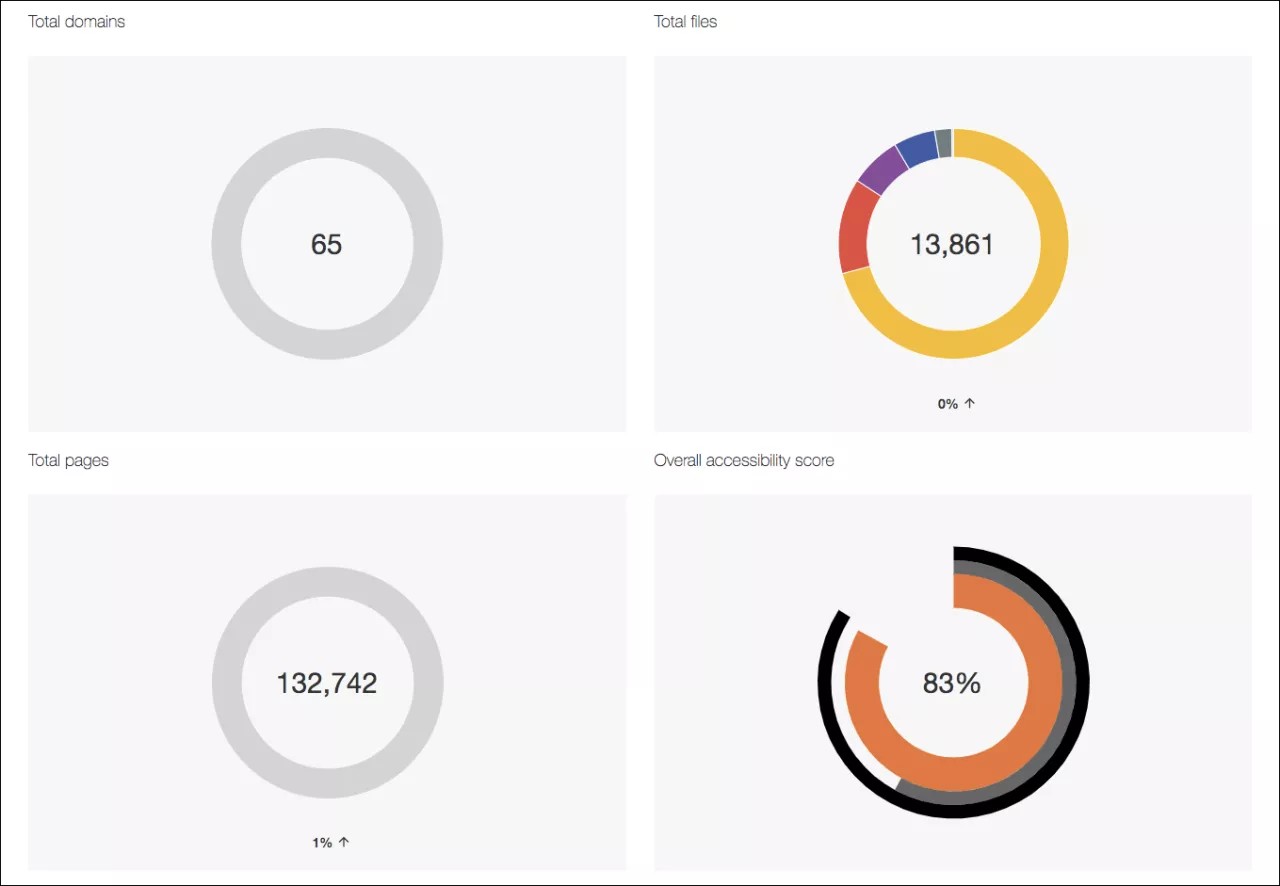
Overall accessibility score
View the accessibility score for the selected period.
Select a new period from the Accessibility score line graph or current period menu to view a different period.
Accessibility issues
See a list of accessibility issues found in the selected period. Select a new period from the Accessibility score line graph or current period menu to view a different period.
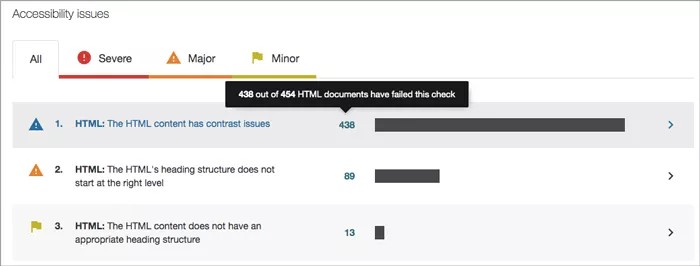
Issues are listed by frequency. Those at the top of the list are most frequent. Select Severe, Major, or Minor to filter the issues by severity. Severe issues should be addressed first.
At-a-glance you can determine basic information for each issue.
File type
Accessibility issue
Severity
Total number of items with the issue
Select an issue to see a full description of the issue and the domains impacted.
From the Domains with this accessibility issue table, you see the domain name, the number of items in the domain with the issue, and the accessibility score. Domains that have that issue the most are at the top of the list.
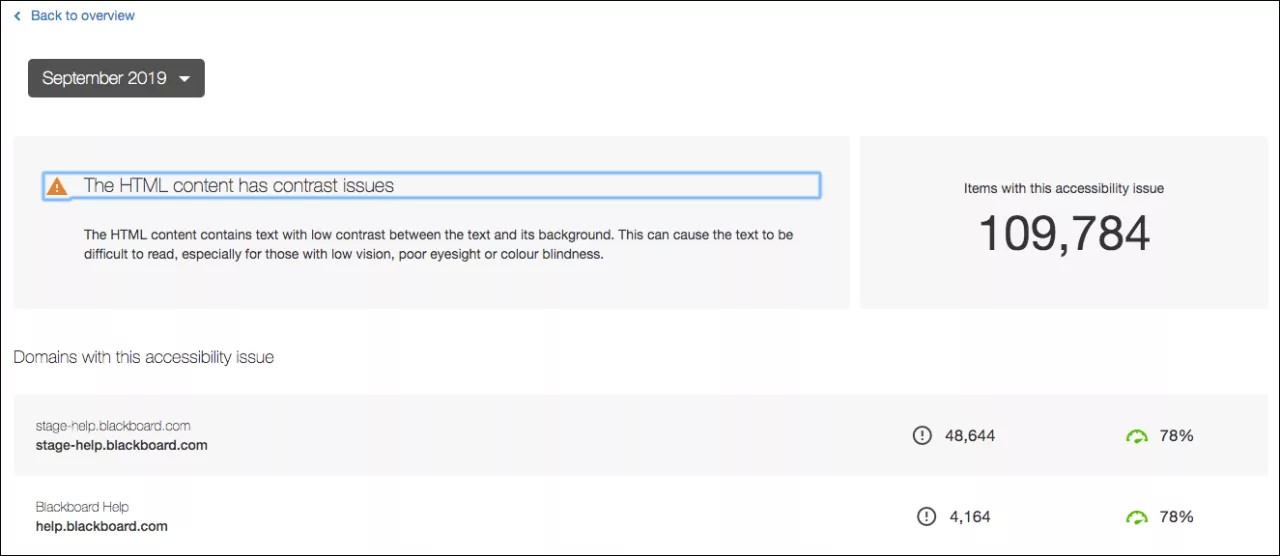
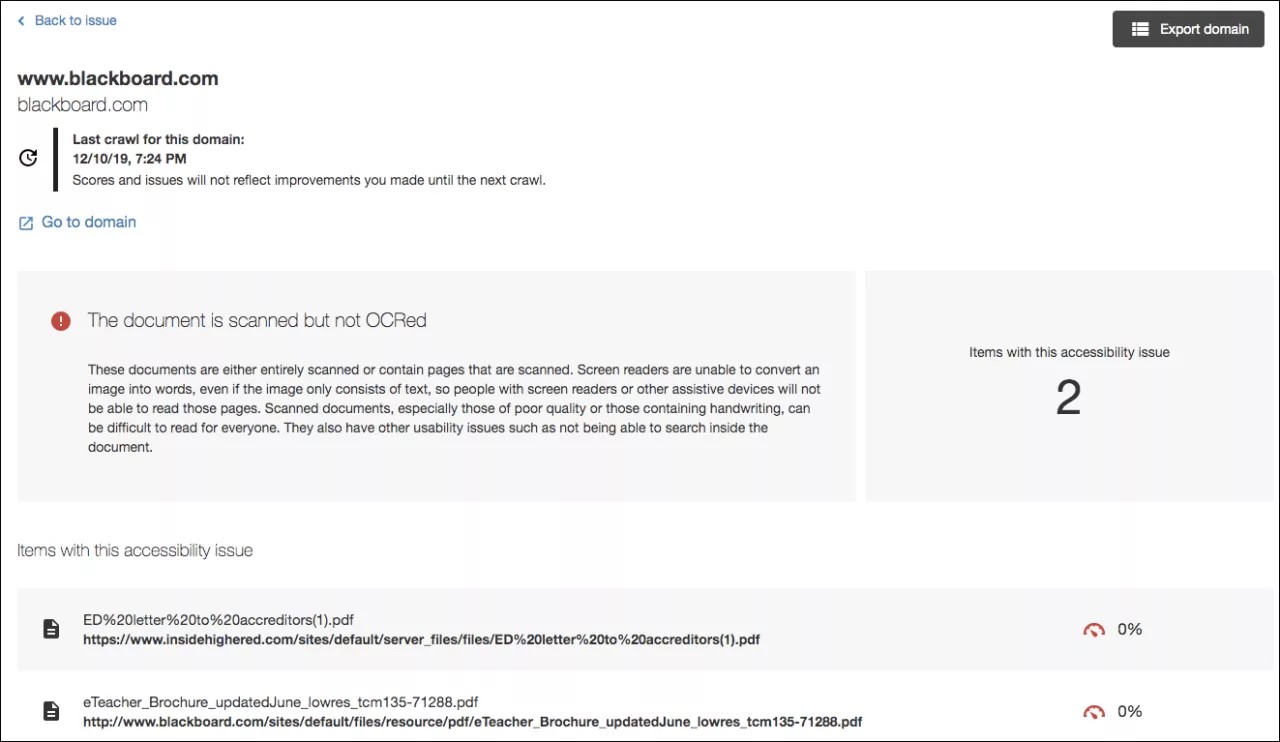
Select Back to overview to return to the Ally accessibility report overview. Select the report period menu to compare domains with this issue in a different period.
Select a domain to see the items with this issue.
See the list of items with the accessibility issue and the accessibility score.
Select Back to issue to return to the Domains with this accessibility issue list. Select Export domain to download the individual domain report. Select a web page or file to see it. Select Go to domain to visit the domain homepage.