Edit Reports
When you click the link for a report on the home page, the report is loaded in reading mode on the embed page. Your login must be associated with the Contributor role.
If your login is associated with the Contributor role, click the Edit Report button to access the report in edit mode.
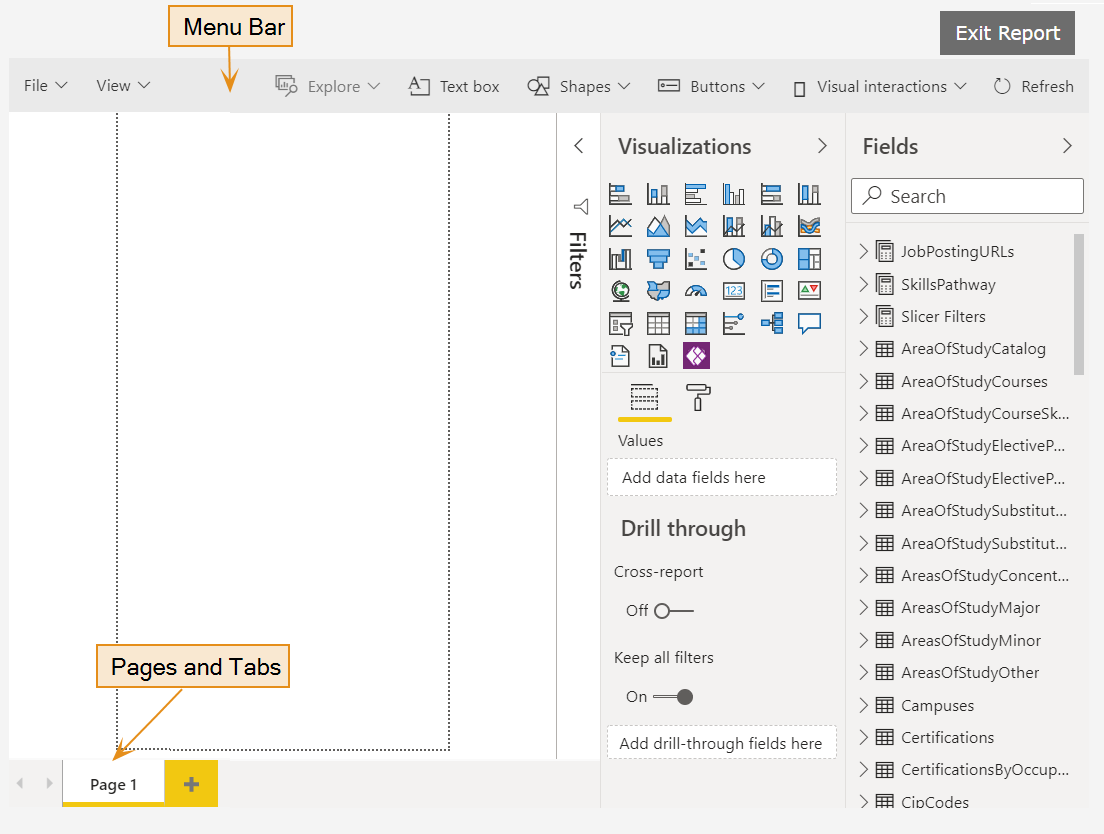
In edit mode, the embedded report displays:
-
A responsive toolbar with the following options:
- File (Save and Save As)
- View
- Ask a question
- Explore
- Text box
- Shapes
- Buttons
- Visual Interactions
- Refresh
- Duplicate this page
- Save
-
A list of visualizations and filter options
-
A list of fields
-
A list of report pages which correspond to the tabs displayed in reading mode unless they are hidden.
The main area of the report is the canvas. You edit the report in the canvas by adding or removing elements, applying formatting, or changing the layout of elements on the canvas.
The data available for use in a report is accessible using the Fields pane.
Change or Remove Items in a Report
-
Click an element on the canvas, e.g., a text box, slicer, or visual. The editing tools applicable to element are displayed. Select a tool and edit the element as need.
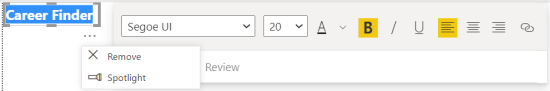
The image below shows the editing tools for a text box. You can edit the text, change its properties, and resize the text box. Click the ellipsis to access more options.
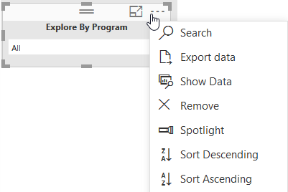
The images below show the editing tools for a slicer and for a donut chart.

-
Use the controls at the bottom of the report to navigate to different pages and to add or delete pages. The pages will be displayed as tabs in reading mode unless they are hidden.

Save your changes as applicable. See Save Changes.
Add a Field
-
Navigate to a field in the Fields list or search for a field.
Refer to Occupation Insight Data for some of the field definitions.
-
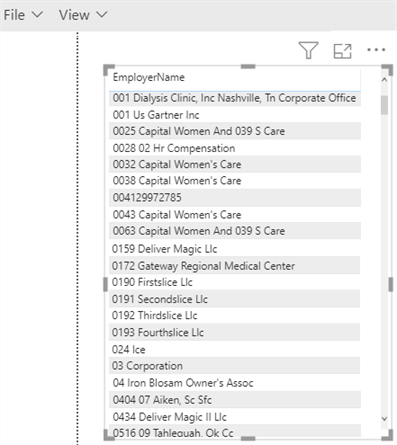
Drag and drop the selected field onto the canvas. A placeholder is displayed.
-
Use the handles on the placeholder to resize the field on the canvas.
-
Click the
 (Focus mode) icon to get a close view of the data in the field.
 -
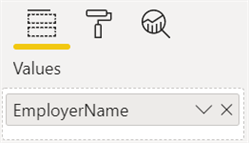
Specify the formatting and sorting properties for the field under the Values settings.
-
After you have dragged a field onto the canvas, you can also change the placeholder into a visual. See Add a Visual.
Save your changes as applicable. See Save Changes.
Add a Visual
Reports can contain various types of visuals that represent various types of data. The following is just a simple outline of the steps to take when adding a visual. There are infinite possibilities. For more details, see Analyzing and Visualizing Data with Power BI.
-
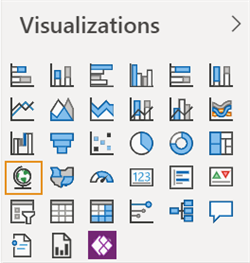
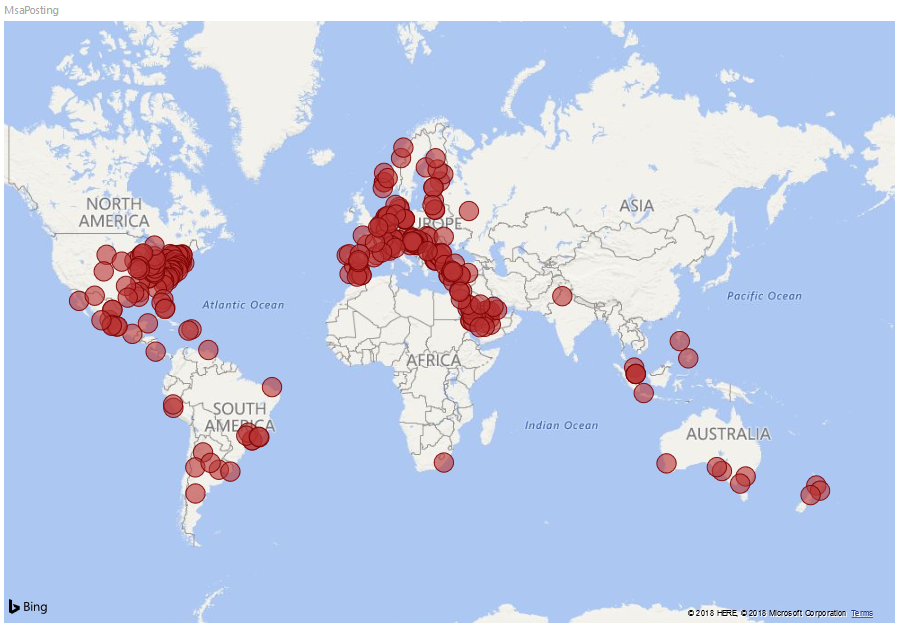
Click on an icon in the Visualizations area. Visuals include bar charts, pie charts, tables, maps, gauges, and other types. A map is selected in the example below.
-
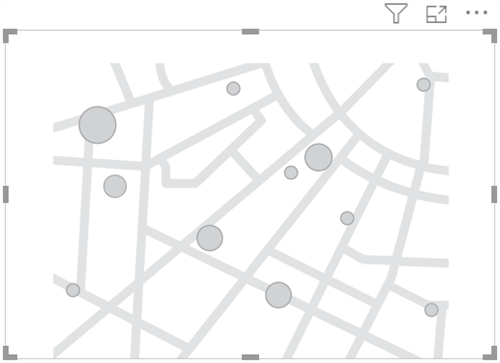
A placeholder for the selected visual type (e.g., map) is displayed on the canvas. Use the handles on the placeholder to resize the visual.
-
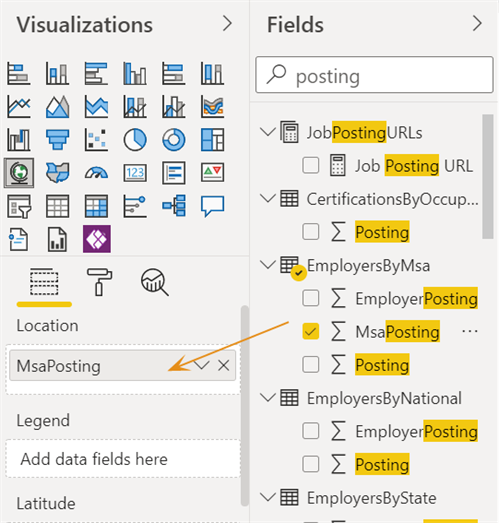
In the Fields list, find the data you want to show in the visual. Drag the selected field into the appropriate well where you see the words Drag fields here.
In our example, we selected the 'MsaPosting' field and dropped it into the Location bucket.
The data buckets vary depending for each visual. For example:
-
A matrix has buckets for Rows, Columns, and Values.
-
A map has buckets for Location, Legend, Latitude, Longitude, Size, Color Saturation, and Tooltips.
-
-
Click the Format tool (
 ) and adjust other visual properties, e.g., data color, background, title, labels, borders, etc. In our example, we changed the default color for data.
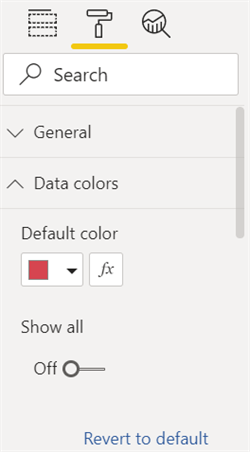
The resulting visual is shown below.

- You can refine the visual by specifying further formatting details and by applying filters to narrow the data selection. See Use Filters.
Save your changes as applicable. See Save Changes.
Save Changes
Save your changes as applicable:
-
If you edited a default report published to your institution's workspace by Anthology Inc., select Save As and give the edited report a new and different name.
Save As will result in the new report being immediately available in the reports listing. The original version of the default report will remain in the reports list.
-
If you edited a report that you previously saved using the Save As option, select Save to save changes made while in edit mode, or Save As to retain the original report and create a new report with a new name.