Use Filters
Filters remove all but the data you want to focus on. Whenever you are analyzing a report you may want to filter your data to specific areas. To do this use the Filters pane. You can filter data in visuals, on a report page, or across the entire report.
Filters in Reading Mode and Editing Mode
The filtering capabilities available to you depend on whether you are in reading mode or editing mode.
In editing mode:
-
You can add visual, page and report filters. When you save the report, the filters are saved with the report. People looking at the report in reading mode can interact with the filters you added but cannot add new filters.
-
The Filters pane is displayed in the bottom half of the Visualizations pane when a visual is selected on the canvas.
In reading mode:
-
You can interact with any filters that already exist in the report. You can explore the data in the report using filters, but you cannot add new filters.
- The Filters pane is displayed along the right side of the canvas. If you don't see the pane, click
 to expand it.
The following is an overview of the steps to take when using filters. For more details, see https://www.youtube.com/embed/SYk_gWrtKvM?list=PL1N57mwBHtN0JFoKSR0n-tBkUJHeMP2cP
Filter Data in Visuals
-
Select a visual on the canvas to make it active and expand the Visualization pane. In the Visualization pane, scroll down to the Filters section.
All the fields that are used to create a visual are also available as filters. The fields used in the visual are listed in the Visualizations pane and in the Filters pane under Visual level filters.
Refer to on Occupation Insight Data for some of the field definitions.
-
Under Visual level filters, expand the field name, and expand the Filter Type option. The filter types include:
-
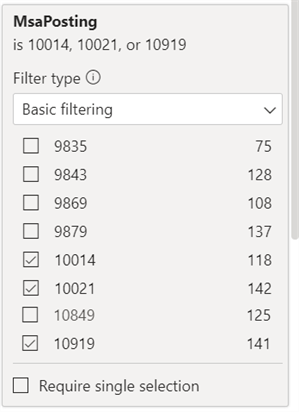
Basic filtering (list mode)
The check boxes represent the available values for that field. Use the All check box to toggle the state of all check boxes on or off. As you adjust the filter, the visual updates to reflect your choices.
-
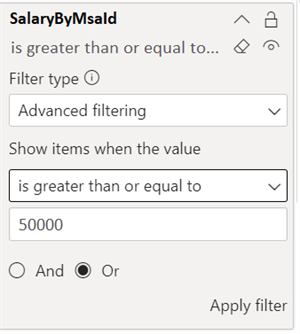
Advanced mode
Use the drop-down controls and text boxes to identify which values to include. By choosing between And and Or, you can build complex filter expressions. Select the Apply Filter button when you've set the values you want.
-
-
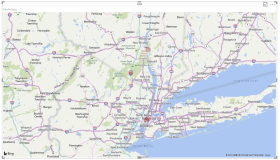
In our example we chose Basic filtering and selected 3 MsaPosting values that we want show on the map visual.
-
You can also add fields to the Filters section and set filters for the additional fields. Dragging a new field into the Visual level filter area does not add that field to the visual, but it does allow you to filter the visual with this new field.
In our example we added the SalaryByMsaId field to the filter.
-
In Advanced filtering mode you can select operators such as 'is greater than', 'contains', etc.
In our example we selected 'is greater than or equal to', specified a value of 50000 for the SalaryByMsaId field.
After clicking Apply Filter, the visual is immediately updated.
Use Slicer Filters
The data slicer tool allows you to filter data on a single page of visualizations.
-
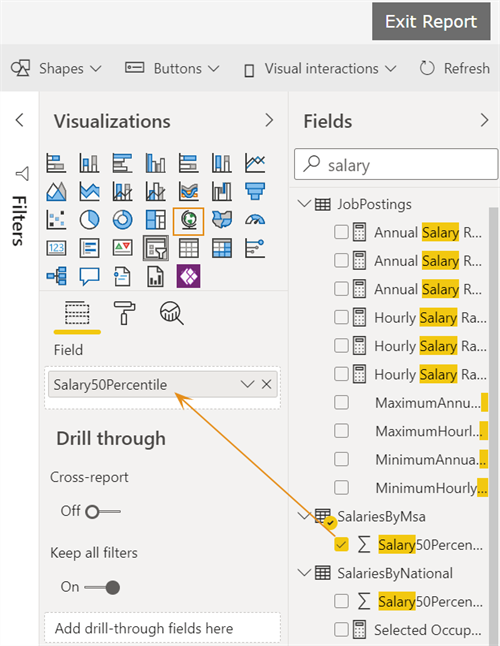
Click the Slicer icon in the Visualizations pane. Drop a field to filter into the Values well where you see the words Drag fields here.
In our example we dropped the Salary50Percentile field into the Values well.
-
Select appropriate properties in the placeholder for the Slicer.
- For discrete values, select a list or a drop-down menu.
- For date values, search by date range.
When you select Format, you have the choose single-select, multi-select, or all values.
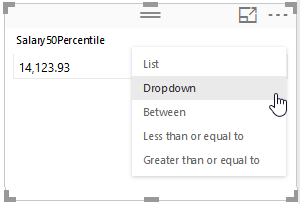
In our example, we placed the slicer next to the map of MsaPostings and selected the Dropdown option for Salary50Percentile data.
-
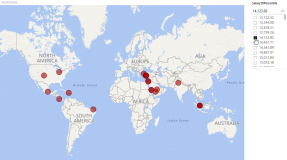
The resulting map with slicer filter is shown below. The data on the map will change with different selections in the slicer dropdown.

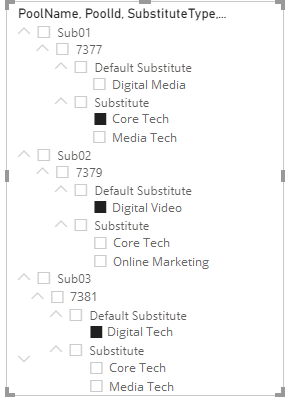
If you want to use a hierarchy slicer visual for substitute pools and you select a substitute, you must select the default courses for each of the other substitute pools to ensure the measures and counts for course and skills are accurate. The illustration provides an example.
Predefined Slicer Filters
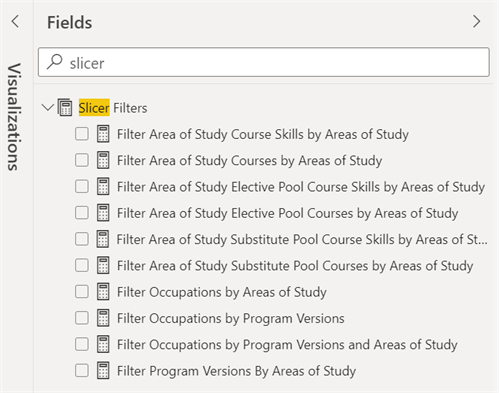
Occupation Insight provides predefined slicer filters. It is necessary to use these slicer filters to ensure data is filtered in visuals as expected. For example, to filter a list occupations by a selected area of study you must apply the Filter Occupations by Areas of Study slicer filter as a visual level filter on the visual containing occupations.
The following illustration shows some of the predefined slicer filters available for you to use.
Page and Report Level Filters
Report and Page Level filters are set-up in a similar way. The difference between the two is that a page level filters only applies to the page it is on while a report level filter applies across all pages of a report. Report and Page Level filters are more flexible than data slicers.
To add one of these filters, drag a field to the Report or Page Level filters section under the Visualizations options.
If you add a field to a filter, you will have the option to do basic filtering (which shows all values which can be selected) or advanced filtering.
Once saved, the Report and Page Level filters will appear on the right side of your report.
