Integration Process Logs
The Integration Hub maintains detailed logs of integration processes on the Integration Process Logs screen.
A centralized logging mechanism saves integration-related log entries in a single place. Customers can reach the logs. The logs provide information for limited self-service resolution of any issues where appropriate, such as the ability to locate and retry any Azure Service Bus messages that have landed in the Dead Letter Queue. Not all issues present in the log are expected to be self-serviceable.
The Integration Process Logs screen leverages the Integration Process Logs API endpoints.
Features
-
Comprehensive Filtering – Quickly narrow down logs using multiple criteria (Business Unit, Integration Type, Product).
-
Detailed Logging – Every integration process is recorded with timestamps and status.
-
Error Insights – Clear error messages help in diagnosing failed transactions.
-
Export Capability – Log data can be exported for further analysis.
-
Raw Data Access – JSON representation provides full context for each integration event.
Screen Layout
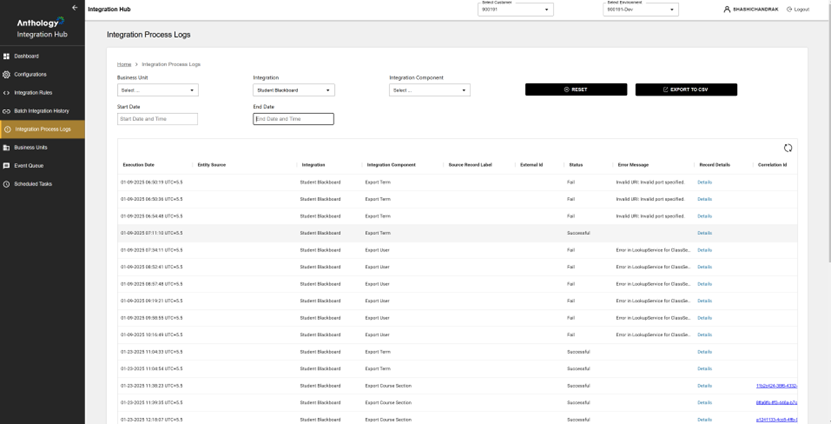
The Integration Process Logs grid displays a detailed list of integration process logs. Key columns include:
-
Execution Date – Timestamp when the integration process ran.
-
Entity Source – The originating system/entity for the data.
-
Integration – Specifies the integration type (e.g., Anthology Student - Blackboard).
-
Integration Component – Identifies which specific function was executed (e.g., Export Term).
-
Source Record Label – A reference to the original source record.
-
External ID – A unique identifier for the processed record.
-
Status – Indicates whether the process was Successful or Failed.
-
Error Message – Displays details of failures, such as:
-
Invalid URL: Invalid port specified.
-
Error in LookupService for ClassSection.
-
-
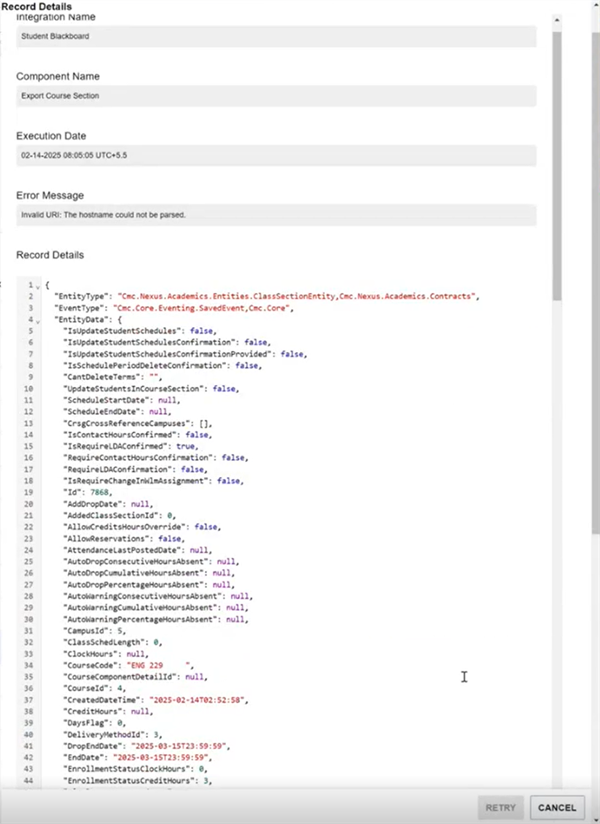
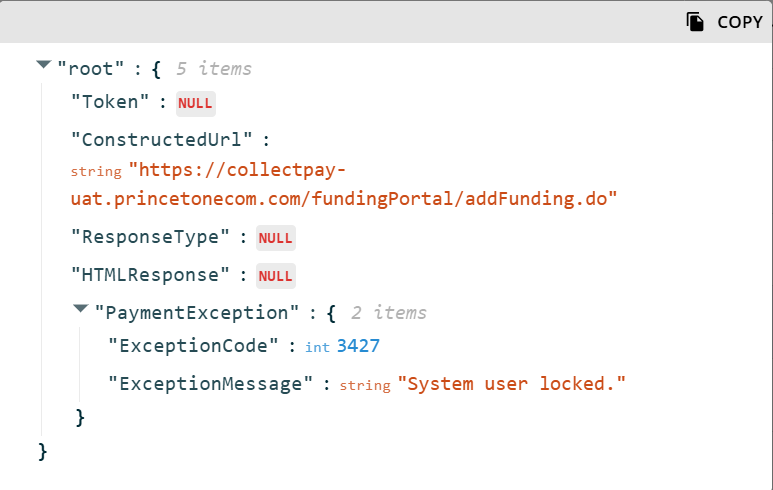
Record Details - Displays the Raw JSON Data View panel with the structured data of the integration event (e.g., data in an Azure Service Bus message) with fields such as:
-
EntityType (e.g., "Cmc.Nexus.Academics.Entity.Term").
-
EventType (e.g., "Cmc.Core.Eventing.SavedEvent").
-
Attributes & Flags (e.g., "IsActive": true, "IsTermOpen": true).
-
Timestamps (e.g., "CreatedDate": "2025-01-07T06:50:14Z").
-
How to Use It
Use the filtering criteria to narrow down logs efficiently. The following filters are available:
-
Business Unit – Allows selection of a specific business unit (if applicable).
-
Integration – Drop-down to choose an integration type (Student Blackboard is selected in the image).
-
Integration Component – Filter based on specific components (e.g., Export Term, Export User).
-
Start Date & End Date – Date pickers to refine logs based on execution time.
-
Reset Button – Clears all filters for a fresh search.
-
Export to Excel Button – Exports the log data for external analysis.
Select the Record Details link for a log entry to access the Raw JSON Data View panel.
You can expand the panel, edit the message, and select the Retry option. The edited retried message will be pushed to the same topic and subscription on the Azure Service Bus of the customer.
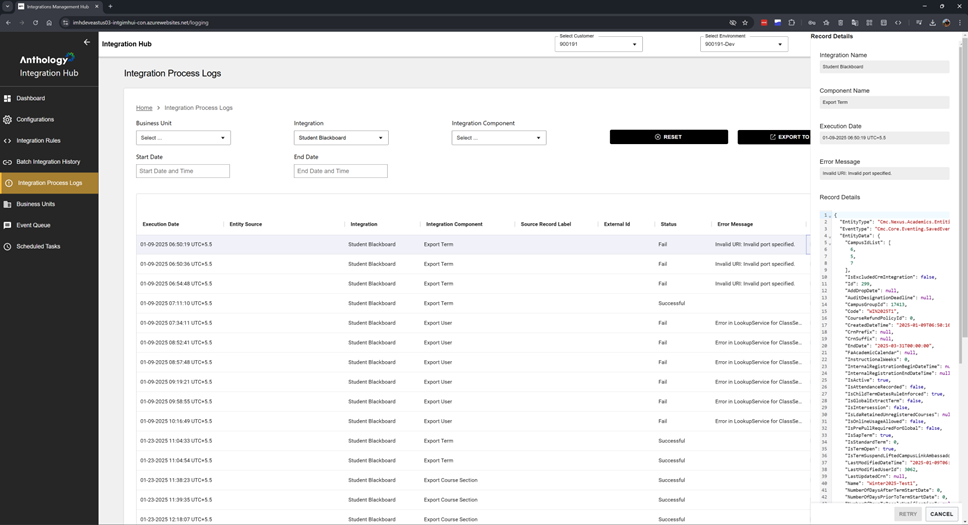
Example of a successful integration message. The Retry button is disabled.
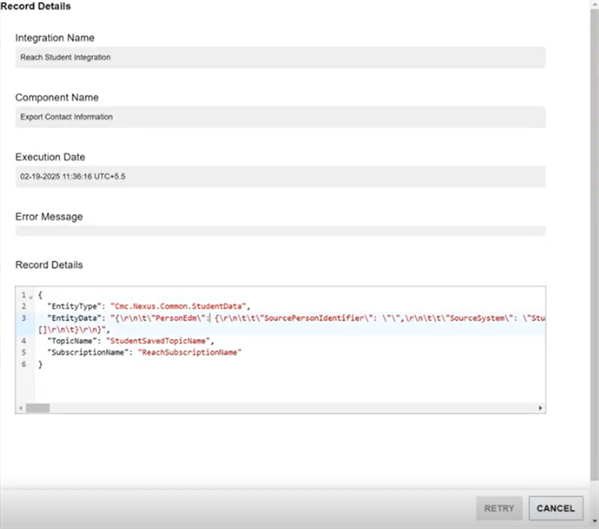
Example of a failed integration message. You can edit and resubmit the message using the Retry button.