Using Talisma Analytics, you can create different types of Cross Tab reports, based on your requirements. You can define mathematical functions that will calculate the data presented in Cross Tab reports. Cross Tab reports can be Regular or Custom.
Regular Cross Tab Reports
Regular Cross Tab reports display one or more Properties of a selected base Object in rows and columns. For example, Opportunity-Owner and Opportunity-Close date for the Opportunity Object. A Regular Cross Tab report can also display Properties of a related Object. Regular Cross Tab reports can be of different types.
• Cross Tab Report Containing a Property in Rows
You can create a Cross Tab report which displays an Object Property in rows, and values based on a related mathematical function in columns.
|
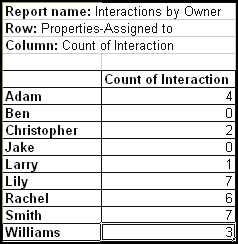
Example You want to ascertain the number of Interactions assigned to each customer service representative in your organization. Create a Cross Tab report by defining the Property Interaction-Assigned to in Rows, and the function Count of Interaction to be displayed in the column. The names of the customer service representatives will be displayed in the rows of the report, and the number of Interactions assigned to each representative will be displayed in the corresponding column. Your report will look like this:
|
• Cross Tab Report Containing a Property in Columns
You can choose to view the selected Object Property along columns, and define a mathematical function to be displayed in rows.
|
Example You want a report on the average revenue generated by each sales representative in your company. You can create a Cross Tab report using Opportunity as the base Object. Define the Property Opportunity-Owner in columns. The values of the selected Property, i.e., names of the sales representatives will be displayed along columns, representing the header row. Specify the mathematical function Average of Properties-Revenue. The value calculated on the basis of the function is displayed in the row. Your report will look like this:
|
• Cross Tab Report Containing Properties in Rows and Columns
A Cross Tab report can display Properties of the selected base Object in rows and columns. The report can also calculate and display the value of a specified mathematical function.
|
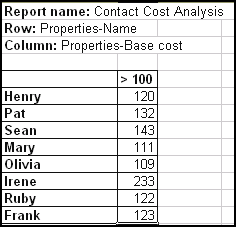
Example You want to track the average cost incurred on creating and maintaining your Contacts. Create a Cross Tab report with the Property Contact-Name defined for the row and the Property Contact-Base Cost defined for the column. Specify the function Average of Properties-Total Cost to be calculated and displayed in the column of the report. You can define a Filter to extract Contacts that cost over $100. Your report will look like this:
|
You can also create a Cross Tab report that displays the Property of the selected base Object along rows, and the Property of a related Object in the column, or vice versa.
|
Example You want to track the number of pending Interactions in the Customer Care division. You also want to know the name of the Contact associated with each pending Interaction. You can create a Cross Tab report with Interaction as the base Object, by defining the Property Interaction-ID along rows. You need to define a Filter to extract pending Interactions. You can then select the related Object (Contact), and specify the Property Contact-Name to be displayed along columns. |
Custom Cross Tab Reports
You can customize Cross Tab reports by creating your own columns or rows in which the selected Object's Properties will be displayed. The custom rows or columns can also display the Properties of an Object related to the selected base Object. You can create different types of Custom Cross Tab reports.
• Cross Tab Report Containing a Property in Rows and Custom Columns
You can customize one or more columns of a Cross Tab report, and define a specific Property of the selected base Object, or that of a related Object, to be displayed in rows. You can also specify the mathematical function that must be calculated.
|
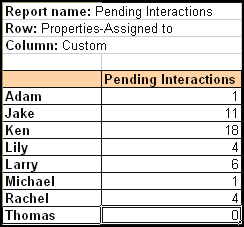
Example You want to ascertain the number of pending Interactions assigned to each member of the customer support team in your organization. Create a Cross Tab report by defining the Property Interaction-Assigned to in rows. The rows will display the names of the customer support representatives as the values of the selected Property. Customize a column named Pending Interactions and define a Filter to extract the pending Interactions. Specify the function Count of Interaction to display the number of pending Interactions in the column. Your report will look like this:
|
• Cross Tab Report Containing a Property in Columns and Custom Rows
A Cross Tab report can be customized to display the required combination of Properties along rows, with the Columns displaying a Property of the Object. You can then specify the required mathematical function.
|
Example You require a report on the Orders generated by different sales representatives in your organization. You would like information about the total revenue generated from each Order, the discounts offered on each consignment, and the time taken in closing the deal. You can create a Cross Tab report with the Property Order-Owner defined along columns, and the following custom rows: a) Revenue: Define the function Sum of Properties-Revenue. b) Discounts: Define the function Sum of Product-Discount. c) Order Closure Time: Define the function Time taken for Properties-State to change from Active to Closed with Days as Units. Your report will look like this:
|
• Cross Tab Report Containing a Blank Row and Custom Columns
You can create simple, high-utility Cross Tab reports by customizing columns to analyze trends, without having to specify Object Properties.
|
Example You would like to know the number of Accounts that were created in the current week, and compare the figure with that of the previous week. You can create a Cross Tab report by customizing two columns, one for the current week's count of Accounts and the second for the previous week's count. You can run this report every week for the count of Accounts at a glance. Your report will look like this:
|
• Cross Tab Report Containing a Blank Column and Custom Rows
Another type of Cross Tab report that you can create is one with only user-defined rows. Such a report can have a mathematical function associated with each custom row.
|
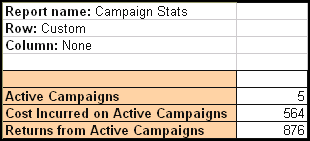
Example To run a report that provides you with the count of active Campaigns, the cost incurred on these Campaigns, and the revenue generated from them, you can create a Cross Tab report with blank columns, and custom rows to display the required values. You can customize each row by defining the appropriate mathematical function. Your report will look like this:
|


